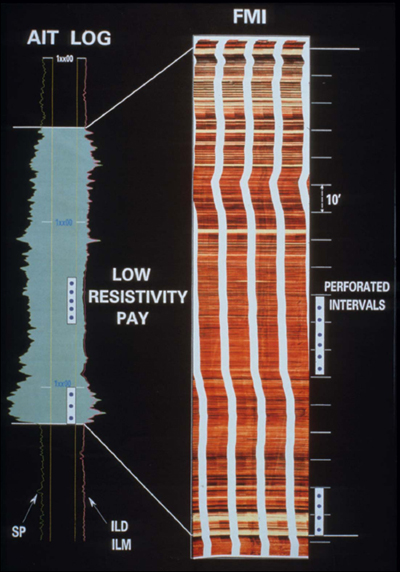
Figure 20. Array Induction log, which is run at 1-ft resolution, and Formation Micro Imager (FMI) of P sand interval. The latter tool defines the nature and cause of the low resistivity pay. It has a resolution down to 0.25” and gives a better “picture’ of what causes low resistivity. The FMI reveals a highly laminated interval with discrete shales and sands. The sands are yellow and the silts are orange.