![]() Click to view poster in PDF format.
Click to view poster in PDF format.
PSEvaluation of Knox Group Dolostones as a Target for CO2 Storage in Western Kentucky*
Michelle A. Pittenger1, Chip Feazel1, Govert J. Buijs1, Ray R. Reid1 and Paul W. Johnson1
Search and Discovery Article #50212 (2009)
Posted October 15, 2009
* Adapted from poster presentation at AAPG Annual Convention and Exhibition, Denver, Colorado, USA, June 7-10, 2009.
1ConocoPhillips Company, Houston, Texas, USA ([email protected])
Much like an exploration play, defining a CO2 storage target starts with understanding the subsurface. This requires the integration of all available data, from core descriptions to seismic interpretation. Unfortunately, in the areas and reservoirs not traditionally explored for oil and gas, these data are rare to non-existent. The Cambrian-Ordovician Knox Group dolostones of western Kentucky qualify as one of these types of potential injection targets. With a database of about 25 well logs, a loose 2-D seismic grid, a few whole cores, and a few well tests, a geologic model of the Knox in western Kentucky was constructed to help understand the potential for CO2 storage in these rocks. Initially, ideas for porosity development in the predominantly tight Knox dolostones were based on geologic models of the age-equivalent Ellenburger and Arbuckle formations. In these formations, karsting plays a dominant role. Evaluation of several Knox whole cores, however, indicated only minor epikarst zones in very low porosity intervals. Most of the porosity development is associated with large dolomite crystal-lined vugs which are interpreted to have precipitated from hydrothermal fluids. Borehole image logs also seem to point towards vugs and fractures as significant contributors to porosity.
Interpreted core and log data were integrated with 2-D seismic interpretations to produce a geocellular model which was used for flow simulation of potential CO2 injection volumes and rates within the Knox Group dolostones. Initial indications are that the Knox Group dolostones have the potential to accept the large volumes of supercritical CO2 necessary for a CO2 storage site, though a significant number of wells may be required. In order to further assess this model, the Kentucky Consortium for Carbon Sequestration will drill a well in early 2009 to test the CO2 injection capacity of the Knox Group and potential secondary targets. Further evaluation of the sealing capacity of the overlying tight carbonates and shales will also be done using whole cores taken in this test well to assess their ability to permanently contain injected supercritical CO2.
|
uModeling Reservoir Properties uSimulation and Field Development
uModeling Reservoir Properties uSimulation and Field Development
uModeling Reservoir Properties uSimulation and Field Development
uModeling Reservoir Properties uSimulation and Field Development
uModeling Reservoir Properties uSimulation and Field Development
uModeling Reservoir Properties uSimulation and Field Development
uModeling Reservoir Properties uSimulation and Field Development
uModeling Reservoir Properties uSimulation and Field Development
uModeling Reservoir Properties uSimulation and Field Development
uModeling Reservoir Properties uSimulation and Field Development
|
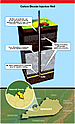
As the world begins to demand clean energy sources in order to slow the steeply rising trend in atmospheric carbon dioxide (Figure 1), traditional coal-fired power plants are searching for new ways to “clean up their act.” Carbon Capture & Storage (CCS) can provide one method for reducing CO2 emissions through the geologic storage of captured CO2. However, capturing CO2 emissions from coal-fired power plants can be quite difficult and expensive. One alternative is to create substitute natural gas from coal through a conversion process called “gasification.” Gasification technologies, like ConocoPhillips E-Gas™, and its associated downstream processes produce a CO2-rich stream (>99% pure) which is suitable for carbon storage.
In July 2007, Peabody Energy and ConocoPhillips announced their joint development efforts to produce substitute natural gas from coal reserves in western Kentucky. (Figure 2) The facility location near Central City in Muhlenberg County was announced with the filing of the air permit application in December 2008. The project has been designed to be carbon storage ready and multiple options for permanent CO2 storage are being evaluated during development. Evaluation of the Knox Group dolostones for CCS is part of this project’s effort to identify an economically and technically viable storage option. Furthermore, given the numerous CO2 emission sources in this region (Figure 3), a large, proven CO2 storage capacity in the Knox Group could be beneficial to many industrial companies looking for a place to store their CO2.
Just like any exploration play, a good understanding of the subsurface is the key to success in defining a potential CO2 target, and understanding the subsurface starts with collecting all the data available. As expected, much of the subsurface data came from typical oil and gas sources — exploration wells, seismic surveys, offsetting producing fields — but other “non-traditional” data sources needed to be evaluated as well. Data from gas storage fields, underground injection wells, and mineral exploration wells proved to be highly valuable to the project.
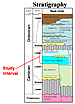
Because the Knox Group is deeper than 3,000’ throughout most of the study area and oil and gas production is generally much shallower, the well penetrations are relatively limited, and Knox well penetrations with available well logs are even more limited (only a couple dozen in all). (Figure 4) State geological surveys served as the main sources for well logs, cores (Figure 5), and information on gas storage fields. Several on-site visits were made to the state surveys to collect these data and interview the state geologists, when available. This direct working relationship provided for a significantly greater knowledge transfer, to the benefit of both parties involved. Direct contacts with injection-well operating companies were also used to obtain detailed injection data. Seismic and well log vendors also provided data used in the project and, in some cases, log data had to be obtained directly from the original logging company.
The Knox Group is composed of the Beekmantown Formation and the Copper Ridge Dolomite (the intervening Rose Run Sandstone is not present in this area). (Figure 6) The Knox is unconformably overlain by the St. Peter Sandstone (thin to missing in much of this area) and underlain by the mixed carbonate and clastic Eau Claire Formation. In this deepest part of the Illinois Basin, the Top Knox Unconformity (Figure 7) forms a gently dipping “bowl,” (Figure 8 and Figure 9) with the deepest point in southern Illinois near the Indiana/Kentucky border.
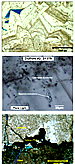
Our observations from six different cores (Figure 10), thin section petrography and fluid inclusion analysis (Figure 11), indicate that late-stage dolomite occurs throughout the Knox Formation and in all six wells. Most typically, this late-stage dolomite occurs as a coarse crystalline replacive phase or as cement in vugs. Vugs may be connected, isolated or at places completely filled with dolomite. The vugs occur in zones but the stratigraphic context of these zones is unclear.
Zones of high permeability would suggest that vugs are connected possibly by fractures. Such high permeability zones may be widespread and related to regional fracture systems.
With petrography and fluid inclusion analyses, the composition and origin of the fluids from which the dolomite precipitated can be inferred. When this origin is understood, a better prediction of the distribution of porosity and permeability is possible.
Some of the dolomite samples have an association with MVT mineral assemblage (e.g.galena). The distribution of MVT minerals is well understood in this area and this understanding may help in predicting reservoir properties for the Knox Group.
Petrographic observations indicate there are three types of late-stage dolomite. In their relative paragenetic sequence, these include a replacive dolomite with a more-cloudy inner-zone (zone A) and a less-cloudy outer-zone (zone B). This dolomite is overgrown by pore-filling saddle-dolomite cement (Zone-C). The cloudy zones are crystal-growth zones which contain fluid inclusions. Most typically, these fluid inclusions are two-phase, aqueous inclusions with a high liquid to vapor ratio.
Fluid Inclusion Data. The fluid inclusions from the three different dolomite zones contain similar yet distinct fluids. (Figure 12) The homogenization temperatures (Th) of the fluid inclusions reflect entrapment of fluids of at least 75° to 145°C. Such temperatures are higher than present day burial (estimated to be between 45° and 55°C). The melting temperature of ice (Tm ice) in the inclusions would compare to brines with about 16 to 24 wt% NaCl (for comparison seawater is about 3.5 wt% NaCl eq.). Zone A fluid inclusions have the lowest Th and lowest Tm ice (and thus the coolest and least saline brine). Zone B fluid inclusions have the highest Th and generally highest Tm ice (and thus the hottest and most saline brine). Zone C fluid inclusions have intermediate Th and Tm ice. The distinction between the three zones would suggest an evolution in fluid temperature and composition. (Figure 13)
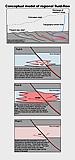
Explanation for different fluid types. A possible explanation for the different fluid types may be related to an evolving topography-driven fluid-flow system. (Figure 14A) In this system, cool meteoric water was recharged in the highlands. This water flowed into the deep part of the basin where temperature and salinity of residing fluids were likely to have been higher. Given sufficient drive, the cool meteoric water may have pushed the hot fluids out of the deep part of the basin and onto the craton. The first pulse of hot fluids out of the basin would likely have mixed with the cooler fluids that were in place at the craton (e.g. fluid A). Then increasingly hotter and more saline fluids would have followed this first pulse (fluids B). Continued influx of cool and fresh water from the highlands into the basin would have caused a decrease in temperature and salinity of the fluids (fluids C). Eventually this topography-driven system would have ceased, because mountain building stopped and topography was eroded. Most of porosity and permeability in the Knox Group is related to late-stage dolomitization. Understanding the origin of this dolomitization will aid in understanding the distribution of reservoir quality. The topography-driven fluid flow model may help explain the distribution of late-stage dolomite on a regional scale. (Figure 14B) On a local, reservoir scale, fracture patterns and other fluid conduits will determine the quality of the Knox Group as storage unit for CO2.
Micro-conductivity borehole images (Figure 15) have effectively recorded vug signatures, allowing for visual correlation to conventional wireline logs and, in best cases, outside surfaces of whole core. While image-based porosity analysis has proven challenging, the following methodology has good potential with judicious application.
Conventional porosity computations were augmented with high-resolution borehole image analysis in an attempt to quantify secondary porosity, primarily from vugs. The normalized, non-calibrated micro-conductivity samples were initially sorted into seven bins, with higher conductivity (darker palette) to the left in track 4. The sorted image samples were then mapped to porosity values utilizing two methods with results displayed in track 3:
PORAVG1 (purple) - Representative Spherically Focused Resistivity values (SFLU; track 2) and Effective Porosity (PHIE; track 3) results were applied to a transform (Akbar et al., 2000), then averaged over the image array at each depth increment (0.00833 feet).
PORAVG2 (orange) – Representative PHIE results were mapped directly to the sorted image and averaged.
While neither method is entirely satisfactory, the results do provide a more realistic signature of secondary porosity. However, calibration with whole core, not available here, is required to scale porosity values correctly.
Knox reservoir properties (Figure 16) were modeled from well log and whole core data (Figure 17), guided by the HTD diagenetic model. Porosity calculated from well logs was interpolated throughout the model, with separate distributions and depth trends for each zone. Because of the lack of a good correlation between porosity and permeability in core data, permeability was modeled using a couple of different approaches. (Figure 18) Permeability ranges for each zone were estimated from core and injection well data and distributed stochastically, using a low poro-perm correlation coefficient of 0.4. (Figure 19) All cells with porosity values below 2% were assigned a permeability value of zero. This base model of a more layered permeability distribution was then modified to define a more vertically distributed, fault-controlled trend, as could be expected in an HTD environment. (Figure 20) This approach was then refined using a bimodal distribution of permeability in two different orientations (based on regional faulting) to show further contrast between fault-related features and matrix. (Figure 21)
Both porosity and permeability models were calculated using high and low ranges to better define the variability in possible outcomes.
Simulation and Field Development
Simulation of CO2 injection into the saline saturated Knox Group dolostones was done using the Eclipse simulator. As dynamic data were limited, the subsurface flow characterization was primarily based on the geomodel description with permeability validated against three dynamic tests. (Figure 22)
The development plan includes vertical or slant wells. Horizontal wells were not chosen as a base case because the Knox is thick and the redictability of high quality reservoir zones is not well understood (due to secondary porosity) and thus could not be targeted. (Figure 23)
The primary objective of the development is to provide sufficient injectivity at minimal costs while staying below a safe injection and reservoir pressure. Since this reservoir has minimal compressibility (water in relatively tight rock), the pressures build quickly, resulting in increased well spacing. For this analysis, the maximum injecting bottomhole pressure was set at 90% of the fracture gradient (assumed 0.7 psi/ft), ~2200 psi at the top of the Knox Group. To inject about 3 TCF of CO2 over a 30-year project life, the simulated development required between 20 and 90 wells, depending on the rock properties modeled. (Figure 24)
The mechanisms for storing CO2 in saline reservoirs are:
1) CO2 solubility in the saline water. 2) Free gas phase structurally or stratigraphically trapped. 3) Residual gas trapped by encroaching water as the CO2 moves through the formation. 4) Precipitates into solids.
Although the CO2 is in the liquid phase in this reservoir, it is less dense than the water and thus will continue to migrate updip until it is permanently trapped or stored by one of the mechanisms listed above. Therefore, the distance a plume of injected CO2 might migrate over a long time period must also be understood. The model was, therefore, run for 1,000 years and migration was shown to be limited to about 8-10 miles given the base case model assumptions.
Key uncertainties around reservoir quality will be investigated with the drilling of a test well, which was spud in April 2009 in Hancock County, KY. A 2D-seismic program was acquired in early 2009 to support drilling of this well. This well has an extensive data collection program planned, including whole cores, image logs, checkshot survey, and injection tests using both brine and CO2. Further investigation of sealing intervals within the Knox Group and above the Knox (Trenton/Black River formations and Maquoketa Shale) will also be conducted using whole core collected from the well. Further details on this test well are presented in the poster entitled “Carbon Storage Potential in the Southern Illinois Basin: Preliminary Results of the KYCCS Test Well, Hancock County, Kentucky.”
Once data from the test well has been fully evaluated, the geocellular model will be revised, as necessary, and fluid flow simulations will be re-run. These results will then be used to formulate a development plan for a possible CO2 storage project in the Knox Group dolostones. (Figure 25)
Even with a favorable outcome of the test well, further evaluation of the Knox will most likely be necessary prior to development of any CO2 storage site. This may include gravity surveys, 2D or 3D seismic acquisition, seismic inversion, and additional well testing using existing or new appraisal wells. (Figure 26) This appraisal phase will require an evaluation similar in cost and scope to any significant exploration discovery, and may be even more rigorous to provide the level of certainty which may be required by government regulators for CCS.
An integrated subsurface evaluation of the Knox Group dolostones has been critical in understanding the potential for CO2 storage in this formation. (Figure 27) Injection information from disposal wells in the region helped to lend support to the possibility for CO2 injection in the Knox Group. Evaluation of whole core and image logs led to a geologic model for porosity development in this tight rock. Geologic modeling and reservoir simulation helped to narrow the range of possible injection rates and volumes. Together, all these analyses indicate that the Knox Group dolostones have the potential to accept the large volumes of supercritical CO2 necessary for a CO2 storage site.
The key remaining uncertainty is still the reservoir quality, specifically, the amount of effective, interconnected porosity and the predictability of these areas of good reservoir quality. The importance of fracturing in the interconnectivity of porous zones is also still unknown. These unknowns translate to a large range in the number of wells and total area required for an industrial scale Carbon Capture & Sequestration project.
Drilling of a test well in Hancock County, KY is the next step needed to improve understanding of the controls on reservoir quality and the true capacity for CO2 storage in the Knox Group of the southern Illinois Basin. Good results from this injection test could have far-reaching implications for many of the CO2 emitters in the area, since the ability to store CO2 at or very near the emission source can significantly reduce overall CCS project costs.
Akbar, M., et al., 2000, Unconventional approach to resolving primary and secondary porosity: 2000 SPE 897297-MS
DOE/NETL, 2006, Carbon Sequestration Technology Roadmap Plan 2006: Web accessed http://www.netl.doe.gov/publications/press/2006/06049-Sequestration_Roadmap_2006.html
Montañez, I. P., 1994, Late Diagenetic Dolomitization of Lower Ordovician, Upper Knox Carbonates: A Record of the Hydrodynamic Evolution of the Southern Appalachian Basin: AAPG Bulletin, v. 78/8, p. 1210–1239.
The authors would like to thank the following: Kentucky Geological Survey for their tremendous support in gathering data, providing access to whole cores, and sharing their expertise on Kentucky geology, in general; ConocoPhillips and Peabody Energy, for providing financial support for this research; and the following ConocoPhillips associates – Gary Myers for petrophysical analysis; Al Shultz for geomodeling work; James Vasquez for technical data support; Hank Tran for drafting support; Scott Rennie for management support.
|