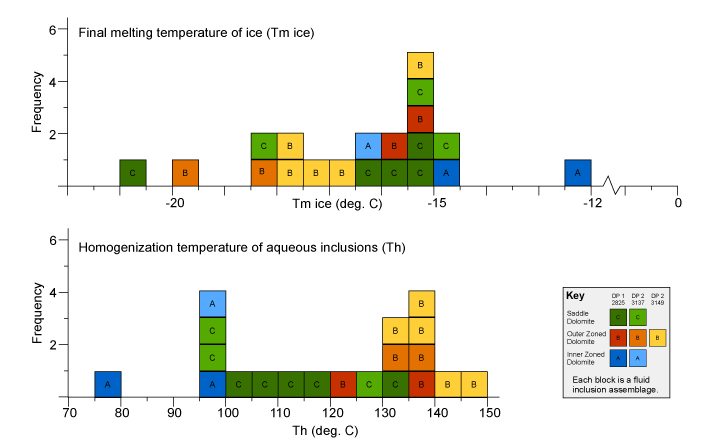
Figure 12. Histograms showing Tm ice and Th of the three dolomite zones A, B, and C. Each of the blocks represents a fluid inclusion assemblage (petrographically related group of fluid inclusions).
Figure 12. Histograms showing Tm ice and Th of the three dolomite zones A, B, and C. Each of the blocks represents a fluid inclusion assemblage (petrographically related group of fluid inclusions).