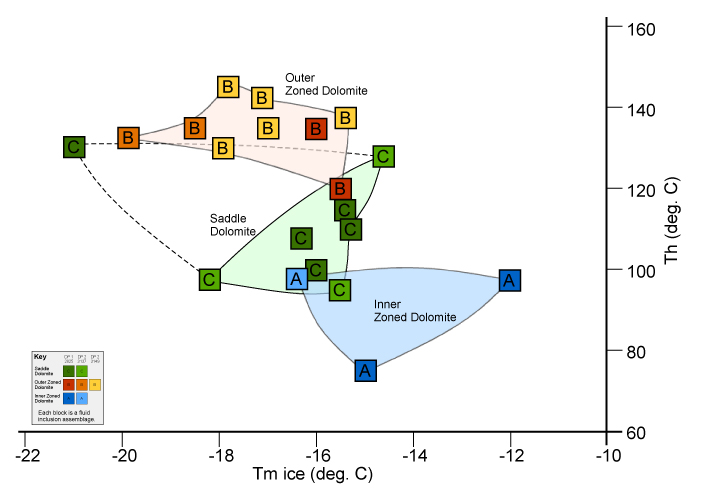
Figure 13. Cross-plot of fluid inclusion Th and Tm ice data. Each zone appears to represent a distinct fluid with a distinct (range in) salinity and temperature.
Figure 13. Cross-plot of fluid inclusion Th and Tm ice data. Each zone appears to represent a distinct fluid with a distinct (range in) salinity and temperature.