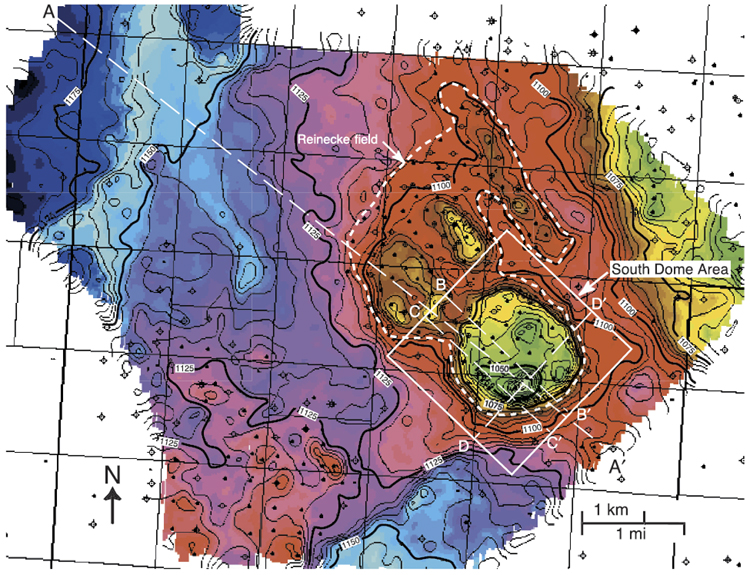
Figure 3. Structure map in seismic time of the upper Pennsylvanian-lowest Permian carbonate at Reinecke field and surrounding areas based on 3-D seismic data. The area has seen little tectonic deformation since the Pennsylvanian; hence, this structure represents the shape of the carbonate buildups after deposition and erosion (late Pennsylvanian to earliest Permian time). Contour interval is 5-ms two-way traveltime (TWT). Seismic section AA’ is in Figure 4, BB’ is in Figure 6, and CC’ and DD’ are in Figure 7. The south dome area was imaged in later 3-D seismic surveys (Figure 5) and modeled (Figures 12, 14).