Click on image to view enlargement.
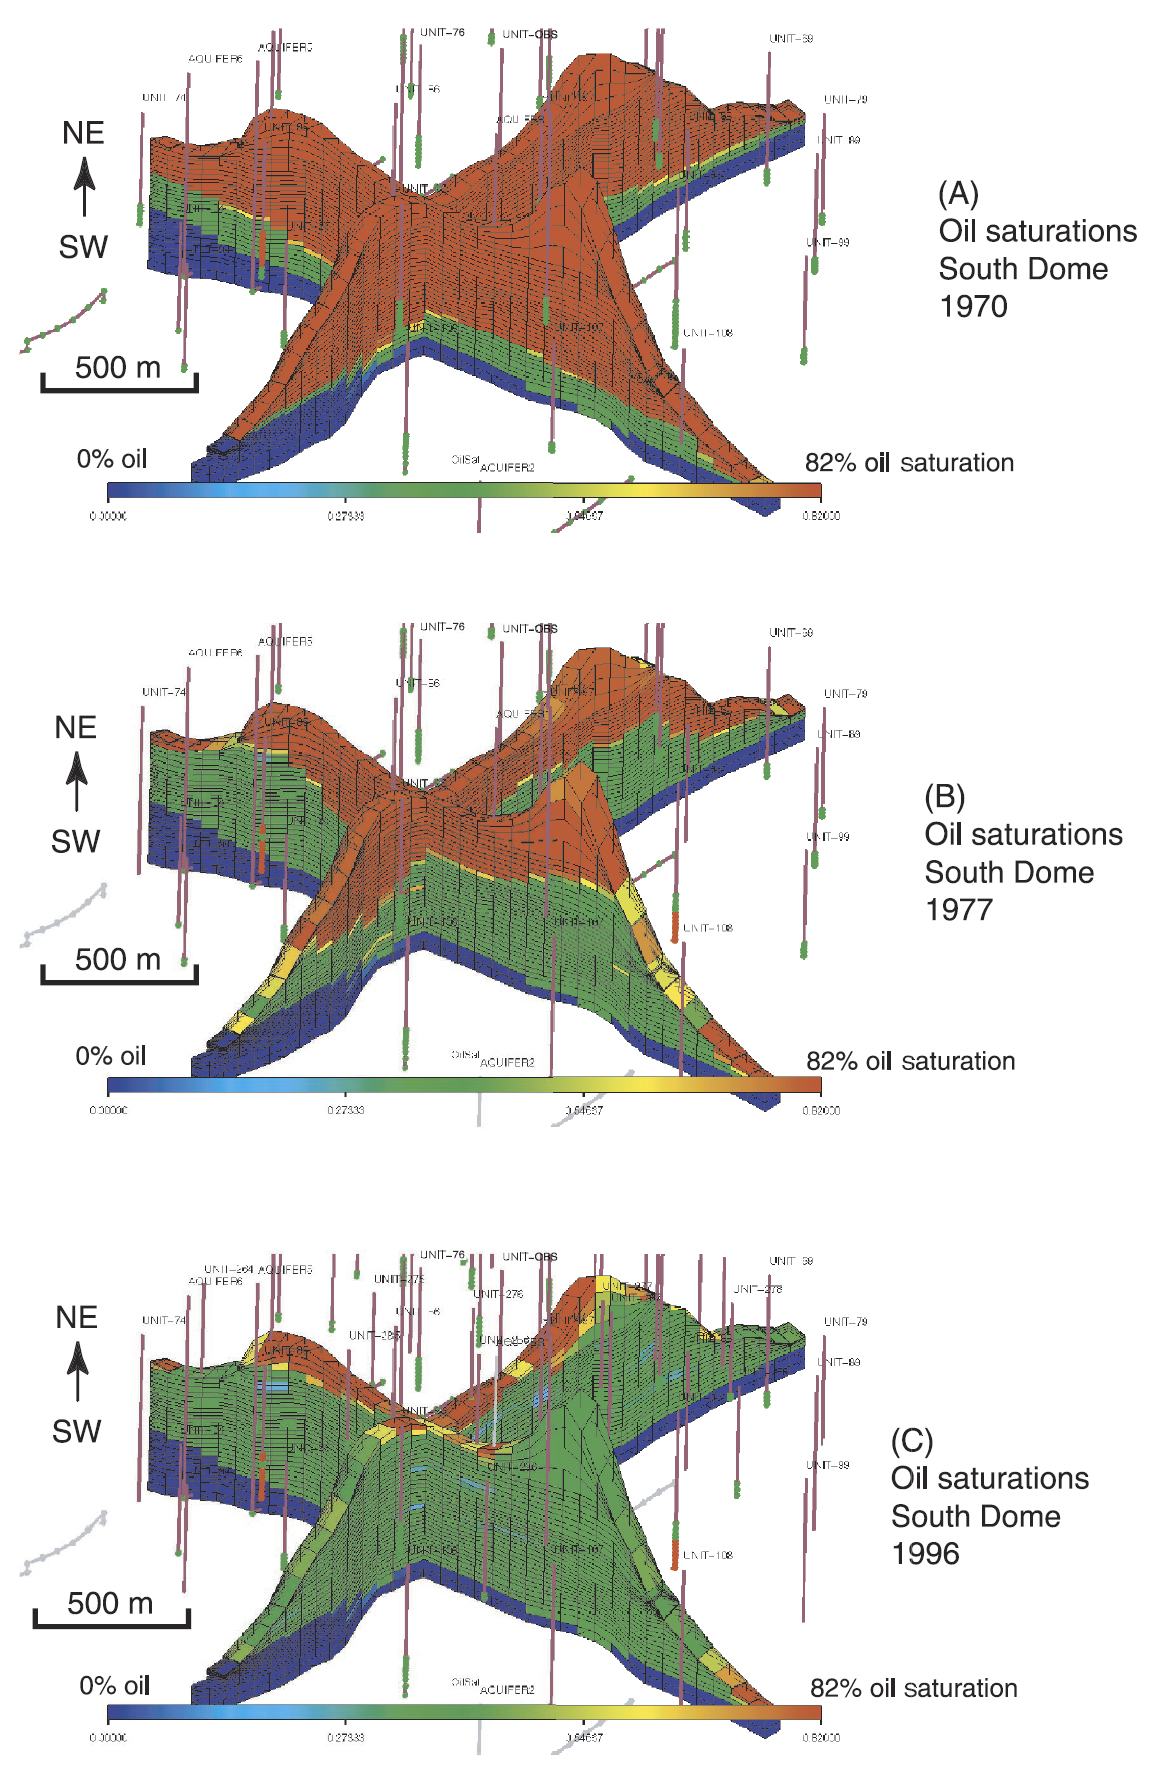
Figure 14. Reservoir simulation of the south dome showing oil saturations as of (A) 1970, (B) 1977, and 1996. Views are from the southwest to the northeast. Oil saturations are shown as a fraction of porosity. Original water saturation in the reservoir was approximately 20% (0.2) of pore space. Vertical relief is approximately 470 ft (143 m), and the south dome shown is approximately 1 mi (1.6 km) across. Between 1950 and 1970, water had moved up from the original oil-water contact (top of blue) and displaced mobile oil in the lower three to five layers (green). Water moved up through the reservoir in a fairly uniform manner displacing mobile oil between 1970 and 1977. As the water front approached the wellbores at the top of the reservoir (B-C), water began to “cone,” resulting in a very heterogeneous distribution of mobile oil. Significant amounts of residual oil 25-40% of OOIP remain in the reservoir, and that is the primary target for the crestal CO2 flood.