![]() Click
to article in PDF format.
Click
to article in PDF format.
Using New 3-D Seismic Attributes to Identify Subtle Fracture Trends in Mid-Continent Mississippian Carbonate Reservoirs: Dickman Field, Kansas*
By
Susan E.Nissen1, Timothy R. Carr1; and Kurt J. Marfurt2
Search and Discovery Article #40189 (2006)
Posted March 25, 2006
*Modified from extended abstract prepared for presentation at AAPG Annual Convention, Calgary, Alberta, June 19-22, 2005
1Kansas Geological Survey, University of Kansas, Lawrence, KS ([email protected])
2Allied Geophysical Laboratories, University of Houston, Houston, TX
Introduction
Mid-Continent Mississippian reservoirs are naturally fractured, solution-enhanced, multi-layered shallow shelf carbonates with strong bottom water drives. Oil production in these reservoirs is strongly influenced by fracturing. The fractures can either be open, permitting water channeling from the underlying aquifer, or shale-filled, providing compartmentalization of the reservoir. A suite of newly developed 3-D seismic volumetric reflector curvature attributes (al Dossary and Marfurt, 2005) have the potential to reveal subtle lineaments that may be related to fractures in these reservoirs. Volumetric curvature attributes are calculated directly from a seismic data volume, with no prior interpretation required, and have been shown to be useful in delineating faults, fractures, flexures, and folds in various geological settings (e.g., Blumentritt et al., 2003, 2005; Serrano et al., 2003; Sullivan et al., 2003, 2005).
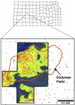
Dickman Field, in Ness County, KS (Figure 1), is a typical Mid-Continent Mississippian reservoir. The reservoir is composed of Meramecian shallow-shelf carbonates, subjacent to a regional pre-Pennsylvanian unconformity and karst surface. Since its discovery in 1962, Dickman Field has produced nearly 1.7 million barrels of oil, with a high water cut (greater than 94%). Volumetric curvature attributes were applied to a 3-D seismic survey over Dickman Field in an attempt to more effectively locate fractures influencing fluid flow in this reservoir.
|
|
Data AnalysisLineaments, which cannot be seen using conventional 3-D seismic attributes, have been interpreted on a maximum negative curvature map extracted along a continuous, high amplitude seismic reflection approximately 25 ms below the Mississippian unconformity on the Dickman seismic survey (Figure 2a). Rose diagrams of the interpreted lineaments (Figures 2b and 2c) show two main orientations -- northeast and northwest. Although the number of lineaments interpreted with northeasterly and northwesterly trends is approximately equal (Figure 2b), the northeast-trending lineaments have greater length and continuity than the northwest-trending lineaments (Figure 2c). The northeasterly lineament trend parallels a down-to-the-north normal fault at the northwest corner of the seismic survey. The lineaments were compared to geologic and production data to determine if a relationship can be identified with shale-filled fractures, which could be barriers to fluid flow, or open fractures, which could serve as water conduits. Evidence for the presence of shale-filled fractures at the top of the Mississippian is found in a horizontal well from central Ness County, KS, approximately 8 miles from the Dickman Field study area (Carr et al., 2000). In this well, numerous near-vertical shale intervals were identified along the lateral length of the well. These intervals were interpreted as solution-enhanced fractures extending down from the karst surface at the top of Mississippian that have been filled by Pennsylvanian shale of the Cherokee Formation (Carr et al., 2000). Since there are no horizontal wells in Dickman Field, indirect evidence was used here to infer the presence of shale-filled fractures. Fractures that were solution-enhanced by post-Mississippian karst and remained open during the Pennsylvanian are likely to have been filled by both Pennsylvanian shale and weathered Mississippian debris. Therefore, it is assumed that locations with evidence of a thicker section of weathered Mississippian material at the base of the Pennsylvanian (subsequently referred to as the “karst zone”) are related to shale-filled fractures. For the purposes of this study, the karst zone in a well was defined as the interval between the highest occurrence of the basal chert conglomerate in the Pennsylvanian section (chert weathered from the Mississippian) and the top of the un-weathered Mississippian. In order to determine whether the shale-filled fractures are preferentially related to either of the two dominant lineament trends (i.e., was one particular fracture direction open and preferentially solution-enhanced during karst formation?), crossplots were created of the thickness of the karst zone versus the distance to the nearest northeast- and northwest-trending lineaments (Figure 3). These crossplots show that there is no apparent relationship between the thickness of the karst zone and the northwest-trending lineaments; however, there is an increase in the thickness of the karst zone within approximately 50 ft of the northeast-trending lineaments. The relationship between the thickness of the karst zone and distance to the northeast-trending lineament suggests that interpreted northeast-trending lineaments are likely to represent fractures, which were preferentially solution-enhanced during karst formation and subsequently filled with shale. Since some of the northeast-trending lineaments have interpreted lengths in excess of 0.5 mile, they may provide significant barriers to fluid flow in the northwest-southeast direction. The relationship between the interpreted lineaments and fluid flow also was investigated by examining the spatial variability of fluid production from the wells in Dickman Field in relation to lineament proximity. In order to evaluate whether there is a link between oil production and lineament orientation, oil production was crossplotted against the distance to the nearest northeast- and northwest-trending lineaments (Figures 4b and 4c). The crossplots indicate that there is no identifiable relationship between oil production and the northwest-trending lineaments, but there does appear to be an overall increase in oil production away from the northeast-trending lineaments. This suggests that oil production is inhibited in proximity to the northeast-trending lineaments where there may be a higher concentration of shale-filled fractures. Water production from the wells in Dickman Field may be related to open fractures that extend into the underlying Mississippian aquifer. In order to evaluate whether open fractures are preferentially linked to lineament orientation, water production was crossplotted against the distance to the nearest northeast- and northwest-trending lineaments (Figures 5b and 5c). The crossplots indicate that there is no relationship between water production and the northeast-trending lineaments but there is increased water production with closer proximity the northwest-trending lineaments. A power law function provides a good fit to this relationship. These results suggest that the northwest-trending lineaments represent fractures, which serve as conduits to the aquifer.
Conclusions3-D seismic volumetric curvature attributes highlight subtle fracture-related lineaments that cannot be identified by other methods. In Dickman Field, 3-D seismic volumetric curvature attributes reveal two main lineament orientations, northeast and northwest. Integration of attribute and well information allows the nature of the fractures (fluid conduits vs. fluid barriers) to be inferred. Northeast-trending lineaments appear to represent shale-filled fractures, which are barriers to fluid flow, while northwest-trending lineaments appear to represent open fractures, which serve as conduits into the aquifer. Understanding the orientations of open and filled fractures in mature Mid-Continent Mississippian reservoirs is an important prerequisite for effectively using techniques such as targeted infill drilling, horizontal drilling, and gel polymer treatments to enhance production.
ReferencesAl-Dossary, S., and K. J. Marfurt, 2005, 3-D volumetric multispectral estimates of reflector curvature and rotation: Submitted to Geophysics. Blumentritt, C., K. J. Marfurt, and E. C. Sullivan, 2003, Application of seismic attributes to the study of poly-phase deformation on the Central Basin Platform of West Texas (abs.): Geological Society of America Abstracts with Programs, v.35, no.6, p.152-153. Blumentritt, C., K. J. Marfurt, and E. C. Sullivan, 2005, Volume-based curvature computations illuminate fracture orientations, Lower-Mid Paleozoic, Central Basin Platform, West Texas: Geophysics (in press). Carr, T. R., S. Bhattacharya, and R. Pancake, 2000, Horizontal drilling in Kansas: A case history: http://www.kgs.ku.edu/Workshops/Horz2000/R640/, posted March 7, 2005. Serrano, I., A. Lacazette, C. Blumentritt, E. C. Sullivan, K. J. Marfurt, and M. Murphy, 2003, Unraveling structural development and fracture distribution at Dollarhide Field, West Texas with new seismic attribute images (abs.): Geological Society of America Abstracts with Programs, v.35, no.6, p.177. Sullivan, E. C., K. J. Marfurt, J. Famini, and D. Pankhurst, 2003, Multi-trace seismic attributes illuminate Permian mass wasting features and processes (abs.): Geological Society of America Abstracts with Programs, v.35, no.6, p.110. Sullivan, E. C., K. J. Marfurt, A. Lacazette, and M. Ammerman, 2005, Application of new seismic attributes to collapse chimneys in the Fort Worth Basin: Submitted to Geophysics.
AcknowledgmentsThe authors would like to thank Grand Mesa Operating Company for providing seismic and well data, Seismic Micro-Technology, Inc. for access to The KINGDOM Suite+ software, and GeoPLUS Corporation for access to PETRA software. Rose diagrams were constructed with GEOrient software, courtesy of Dr. R. J. Holcombe, University of Queensland (http://www.holcombe.net.au/software/). Funding for this work was provided by the U. S. Department of Energy. |