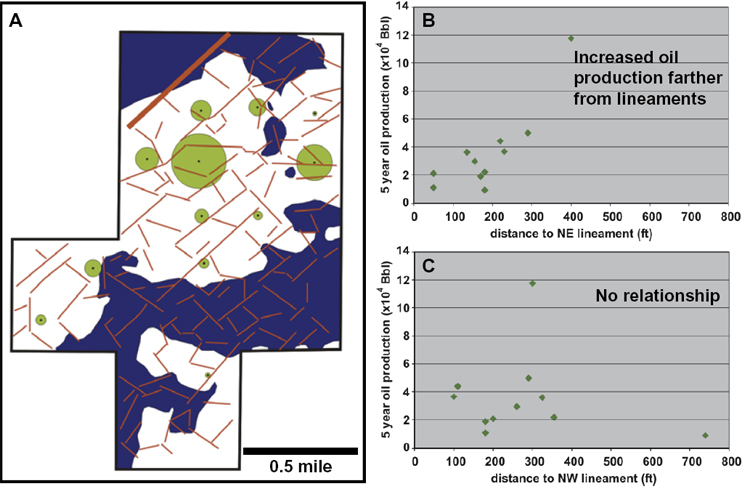
Figure 4. A) Bubble map showing with green circles the amount of oil produced during the first 5 years of production for each well within the Dickman seismic survey. The largest circle corresponds to approximately 117,600 Bbl. Interpreted lineaments are shown in red, and areas where the top of Mississippian is below the oil-water contact are shown in dark blue. B) 5-year oil production versus distance to nearest northeast-lineament. C) 5-year oil production versus distance to nearest northwest-trending lineament.