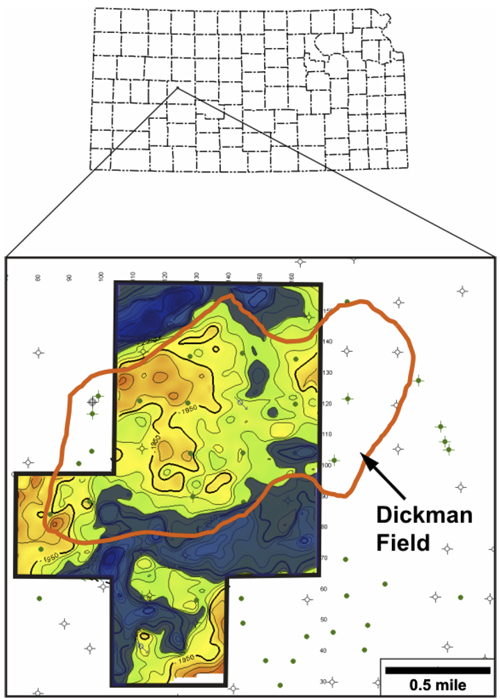
Figure 1. Location map showing Dickman Field (red outline) and the Dickman 3-D seismic survey (black outline). Contours of depth (subsea) to the Mississippian unconformity surface derived from 3-D seismic interpretations are shown. C.I. = 10 ft. The blue shaded overlay indicates areas where the Mississippian unconformity is beneath the oil-water contact.