![]() Click
to view posters in PDF format.
Click
to view posters in PDF format.
Download of hi-res; large file posters (right mouse click, save target as...)
Assessing Subeconomic Natural Gas Resources in the Anadarko and Uinta Basins*
By
K.K. Rose1, A.S.B. Douds2, J.A. Pancake2, H.R. Pratt III2, and R.M. Boswell1
Search and Discovery Article #10069 (2004)
*Adapted from poster presentation at AAPG Annual Convention, Dallas, TX, April 18-21, 2004.
1Department of Energy, Morgantown, WV ([email protected]) ([email protected])
2EG&G Technical Services, Morgantown, WV ([email protected]) ([email protected])
Abstract
Natural gas resource assessments are a commonly used tool by industry, academia, and government to understand the current and near-term recoverability of the nation’s resource base. However, these resource assessments tend to be static pictures of a resource that is, in reality, highly dynamic. Assessment based on gas-in-place (GIP) analysis and iterative modeling of resource recoverability under a variety of technology/policy scenarios provide improved means to identify the most promising approaches to expanded resource recoverability.
This study collects detailed, spatially distributed, geologic and engineering information on key segments of the nation’s under-utilized gas resource base. Phase one of this study, completed February 2003 for the DOE’s National Energy Technology Laboratory, provided detailed GIP resource assessments for the Greater Green River and Wind River basins. Phase two of this effort focuses on the Tertiary and Cretaceous sections of the Uinta Basin, and the mid-Pennsylvanian and older strata of the deep Anadarko Basin.
Through the correlation and analysis of hundreds of log suites, and drilling and completion records, key geologic and engineering parameters including depth, potential pay thickness, porosity, pressure, water saturation, and temperature were determined and used to produce detailed characterizations of the GIP for each unit analyzed. In conjunction with DOE modeling efforts and permeability analyses, this study provides a detailed, disaggregated, geologic and engineering database for modeling the impact of different technology scenarios on the future of U.S. natural gas exploration, production, and supply.
|
|
Project BackgroundResource assessments conducted at NETL support the DOE's natural gas R&D program planning with a focus on:
The disaggregated databases generated for each assessment are used to analyze the potential of different technologies under a variety of future scenarios. The study enables analyses as to why key segments of this gas are currently unrecoverable and provide insight into the R&D needed to accelerate its entry into the resource base. Figures 1.1, 1.2, and 1.3 show the significance of “unrecoverable” gas resources and the importance of technology in their conversion into a technologically recoverable resource.
Current and Completed Basin Studies This gas-in-place resource assessment effort is continuing currently in the Anadarko Basin of Oklahoma and Texas and the Uinta Basin of Utah (Figure 1.4). Previous studies included the Wind River Basin and the Greater Green River Basin.
Project Methodology
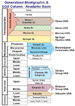
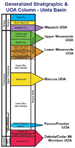
Definitions of Units of Analysis (UOAs) Units of Analysis (UOAs) were defined for each basin (Figures 1.5 and 1.6), based on the drilling and completion histories of the formations. Reservoir properties, such as porosity, permeability, water saturation, and shale-volume, are averaged over the entire UOA for any one data point; therefore, UOA definition is critical. Industry practices are taken into account by analyzing drilling and completion histories in the formations. In the "deep" Anadarko Basin eight UOAs were identified based on these criteria (Figure 1.5), and in Uinta Basin six UOAs were defined using the criteria (Figure 1.6).
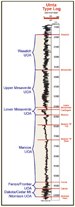
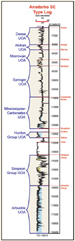
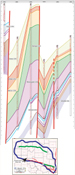
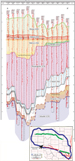
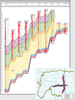
Once the UOAs were defined based on the drilling/completion history in the basin, UOA extents were defined through correlation of well logs throughout the basins. In the "deep" Anadarko Basin, UOA boundaries (Figure 1.7) were typically delineated by structural features, erosional boundaries, and the 10,000' MD structure contour for each. UOAs in the Uinta Basin (Figure 1.8) were separated into shallow and deep zones based on stratigraphic depth and density of data. The deep portion of the UOAs generally contain significantly fewer well penetrations. Type logs were generated in the Uinta Basin (Figure 1.9) and southeast "deep" Anadarko Basin (Figure 1.10), to show the lithologic and stratigraphic distribution of the UOAs. Uinta UOAs are primarily clastics, whereas in the Anadarko Basin, there are both clastic and carbonate UOA packages.
The project workflow, from data collection to technology modeling, is diagrammed in Figure 1.11, which shows the basic model followed for each resource assessment in order to determine GIP. The elements of the model are also listed, as follows:
After correlation of the well logs, log analysis is performed in order to collect reservoir properties for the UOAs and determine the variation within the basin of those properties. The properties collected during log analysis include: (1) Drilling depth (2) Net thickness (shale-volume < 50%)** (3) Average shale resisitivity (4) "Potential pay" thickness **Note: This property was not used to calculate GIP. These values are mapped to create the Isochore/Isolith maps indicating sandstone distribution throughout the basins.
Generally, the following parameters were used by the geologist when determining "potential pay" of clastics (Figure. 1.12):
The following properties are collected over the "potential pay" interval: (5) Average shale-volume (6) Average porosity (7) Average resisitivity
Parameters 1 and 3-7 are entered into either the Simandoux or Archie equations to calculate water saturation. Water saturations >70% are considered wet for this analysis.
Generally, the following parameters were used by the geologist when determining "potential pay" of carbonates (Figure 1.13):
The following properties are collected over the "potential pay" interval:
These parameters are entered into the Archie equation to calculate water saturation. Water saturations >70% are considered wet for this analysis.
A target data density of one well per township was sought for each UOA. However, in most UOAs, data density decreases with increased drilling depth, because the number of well penetrations decreases with depth (Figure 1.14). As such, resolution in those resource calculations decreases with increasing depth.
Data SourcesBelow is a list of references for data used in the assessments Well Logs: A2D, MJ Systems, In-house Microfiche Well Data (location and production): IHS Energy, Texas RRC Core Data: Oklahoma Geological Survey, IHS Energy Rw Data: USGS Produced Rw Database, SPE Survey of Rw Data in Oklahoma,1988 Temperature Data: P.K. Cheung, 1975, " The Geothermal Gradient in Sedimentary Rocks in Oklahoma", M.S. Thesis Oklahoma State Univ. (OSU); BHT data collected from log headers; IHS Energy Pressure Data: OSU "Pressure Data on the Anadarko Basin", OSU website IHS Energy
Example Maps and Cross Sections for the Anadarko and Uinta Basins
Morrow UOA (Figures 2.1, 2.2, and 2.3) Anadarko Basin Cross Sections (Figures 2.4 and 2.5)
Lower Mesaverde UOA (Figures 2.6, 2.7, and 2.8) Uinta Basin Cross Sections (Figures 3.1 and 3.2)
Dataset Preparation
Areas of Historical Production After values for potential pay thickness have been determined for every grid cell, areas of significant historical production or grid cells that are interpreted as wet due to interpolation of log analysis values will be extracted from the dataset (Figure 3.3, as an example). This will result in a database that reflects the remaining gas-in-place potential for all UOAs studied in the basins.
UOAs will be gridded at the township level (Figure 3.4). Grid spacing is designed to correlate with the data density. Gridding the unevenly spaced data results in an even distribution of points with a value in the center of the cell.
In the past decade the USGS National Assessment quantified technically recoverable resources for most major US basins, including the Anadarko and Uinta Basins (Figures 3.5 and 3.6). In basins where gas-in-place assessments have been completed, data indicate that only 2% of the existing GIP is technically recoverable. The remaining 98% represents one of the nation's largest untapped natural gas resources. Expanded access to this gas will require the development of advanced technologies specifically tailored to unlock this segment of the resource. In order to identify the most promising R&D opportunities, NETL uses sophisticated computer models of the national natural gas E&P system. To increase the reliability of the results, this study produces model databases which capture the geologic variety of resource occurrences.
Stratigraphic Disaggregation and Volumetric Results The results can be characterized by the amount of resource contained at specific drilling depths. However, the stratigraphic and geographic disaggregation of the resource gives a more accurate picture of how the resource is distributed among the UOAs of the basin (Figures 3.7 and 3.8).
(G. Koperna, G. Bank, T. Graham, ARI)
ARI was tasked with deriving bulk permeability estimates for each UOA. Methodology, as illustrated in Figure 3.9 for the Anadarko Basin, is: 1) Identify producing fields for each UOA. 2) Identify low, average, and high-productivity wells using estimated 30-year EUR by field/area (Figure 3.9A). 3) Analyze logs to calculate H for perforated zones in suitable candidate wells. 4) Type curve match production history to determine permeability for the wells (Figure 3.9B). Table in Figure 3.9C shows the averaged values for the 10 wells in each category.
The bulk permeability results provided by ARI will be used in conjunction with structural complexity mapping to determine permeability for each UOA. Structural complexity will be determined through analysis of existing structural features and surface and subsurface lineament data from each basin (as illustrated in Figure 3.10).
DOE’s National Energy Technology Laboratory is modeling the recoverability of major untapped resources in an effort to identify the most promising R&D opportunities. · Through log based analyses, NETL's resource assessment of the "deep" Anadarko Basin seeks to produce a detailed, disaggregated dataset of the basin's tight, deep, and unconventional formations. This dataset will assist DOE modelers in the identification of future technologies that can unlock GIP resources and help shift them to a technically or economically recoverable status. Previous model datasets have been upgraded through new studies of the gas-in-place in the Greater Green River Basin and Wind River Basin that capture the full natural variety in key parameters. Basins currently under investigation are Anadarko Basin and Uinta Basin.
COGA presentation of GGRB &WRB Assessments, Denver, CO, August 2002 GGRB & WRB Assessments published in Gas TIPS, Summer 2002
Assessing the Technology Needs of Unconventional Gas Resource, May 20,
2003 Presentation of the Anadarko Assessment at the "Unconventional Energy Resources in the Southern Midcontinent" OGS workshop, March 2004 GGRB & WRB assessments presented at the 2003 national AAPG convention Poster presentation of the Anadarko and Uinta assessments at the 2004 national AAPG convention, after acceptance of abstract Abstract accepted for presentation of the Uinta Assessment at the August, 2004, RMAG-COGARMR AAPG joint meeting, Denver, CO GGRB
& WRB Final Report CD: The maps, cross sections, and other data generated in this study will be available in a CD format in the Fall of 2004. For more information regarding the National Energy Technology Laboratory visit the website at: www.netl.doe.gov.
This report was prepared as an account of work sponsored by an agency of the United States Government. Neither the United States Government nor any agency thereof, nor any of their employees, makes any warranty, expressed or implied, or assumes any legal liability or responsibility for the accuracy, completeness, or usefulness of any information, apparatus, product, or process disclosed, or represents that its use would not infringe privately owned rights. Reference therein to any specific commercial product, process or service by trade name, trademark, manufacturer, or otherwise does not necessarily constitute or imply its endorsement, recommendation, or favoring by the United States Government or any agency thereof. The views and opinions of authors expressed therein do not necessarily state or reflect those of the Unites States Government or any agency thereof. |