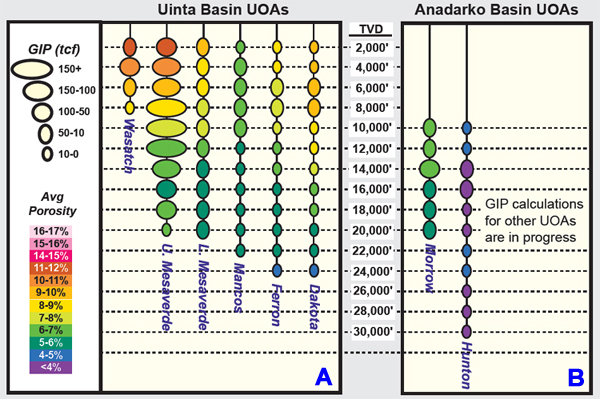
Figure 3.7. Schematic representation of resource distribution by depth in the dataset resulting from this study. A. Uinta Basin UOAs. B. Anadarko Basin UOAs.
Figure 3.7. Schematic representation of resource distribution by depth in the dataset resulting from this study. A. Uinta Basin UOAs. B. Anadarko Basin UOAs.