|
Figure Captions
Return to top.
The application of aeromagnetic data to
hydrocarbon exploration has moved from primarily mapping basement
structures and lithologies to imaging and mapping structures within the
sedimentary section. High-resolution aeromagnetic (HRAM) surveys are now
relatively inexpensive tools for 3-D mapping of faults and fracture
systems propagating through hydrocarbon-bearing sedimentary levels.
Advances
in data acquisition techniques (enhancements in magnetometers,
compensation software/hardware for suppressing airplane noise,
positioning utilizing GPS systems, pre-planned drape surveys,
gradiometers measuring horizontal and vertical total magnetic intensity
gradients, etc.), as well as data processing and displaying procedures
(such as micro-leveling), have significantly improved data quality and
resolution, providing levels of detail that are compatible to those
derived from seismic, well, and surface geological data.
Current
industry standards view "high-resolution" aeromagnetic data as
fixed-wing surveys with flight-line spacing of 400-800m and tie-lines
every 1200-2400m, and with mean flight clearance of 100-125m.
The
Canadian petroleum industry has been receptive to the introduction of
HRAM data as a tool for exploration. Consequently, a large volume of
HRAM data has been collected over both mature and frontier portions of
the Western Canada Sedimentary Basin (WCSB), including part of the
highly deformed Canadian Fold Belt.
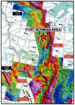
A portion
of HRAM data collected in the WCSB is shown in
Figure 1. The imagery represents an amalgamation of several
different speculative HRAM surveys that were collected over the past
decade by industry vendors and the Geological Survey of Canada (GSC).
The area
contains approximately one million line-kilometers of HRAM data
(representing about a third of the total data collected in the entire
basin), covering parts of the WCSB and Mackenzie Corridor. We focus
first on the Canadian Fold Belt region because:
-
The geological structures
that will be shown are clearly detached from the basement, and thus
illustrate that HRAM data can image sedimentary structures.
-
Fold belt regions are
usually characterized by extremely complex structures that are
difficult (and extremely expensive) to image with seismic data.
-
The collection of HRAM data
is done in a non-invasive manner and therefore can be collected in
environmentally sensitive areas.
-
The rugged topographic
relief of fold belts allows us to demonstrate the ability of the new
surveys to overcome the effects of topography on the magnetic
signature of structures.
-
Fold belt regions appear to
represent a significant portion of the remaining uncharted areas for
frontier oil and gas exploration.
In 1998
the GSC began to collect a series of non-exclusive HRAM surveys along
the Mackenzie Corridor. HRAM data was collected at 800m flight-line
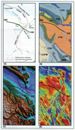
spacing and mean elevation of 125m above ground. One such survey was
collected over the Fort  Norman Norman area, along a partially exposed portion
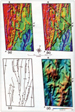
of the Mackenzie Mountains thrust belt (Figure 2).
In this area, the structural style of the fold belt is further
complicated by the presence of a major northeast-trending tectonic
element known as the Gambill Shear Zone (GSZ). area, along a partially exposed portion
of the Mackenzie Mountains thrust belt (Figure 2).
In this area, the structural style of the fold belt is further
complicated by the presence of a major northeast-trending tectonic
element known as the Gambill Shear Zone (GSZ).
Figure 2a illustrates that in the subsurface
the Gambill Diapir acted as a transfer zone, linking the GSZ with the
Norman Wells Thrust (MacLean and Cook, 1999). Geological mapping (Figure
2b) and the digital elevation model (Figure
2c) show that the structural features associated with these tectonic
elements are only partially exposed at the surface.
However,
the HRAM data (Figure 2d) clearly
demonstrate that the transfer zone reflects the presence of a complex
shear element that exhibits basement-involved, right-lateral faulting,
which resulted in a complex pattern of surface and near-surface
anticlines.
In
addition, one can notice that the overall magnetic intensities do not
reflect the rugged topography found in this region.
The block
diagram shown in Figure 3 illustrates that
the GSZ consists of high-angle wrench faults and a series of tight salt
core anticlines that developed and wrapped around a structural high to
the north. Strike-slip reactivation of northeast-trending basement
faults may have triggered the development of salt diapir structures
along this fault zone during Laramide deformation.
Our
experience in fold belt regions shows that HRAM data collected at
sufficient resolution and flown at low altitude can resolve magnetic
signatures that are associated with structures found within the
sedimentary section. Studies have shown that HRAM data can image the
internal geometry of folded strata, given that they detect minute
variations in the magnetic response of near-surface deformed rock
units.
For
example, an HRAM TMI (total magnetic intensity) profile nearby the
Coleman gas field in the southern Canadian Fold Belt reveals that
lithostratigraphic units produce magnetic "highs" and "lows" (Figure
4). In this case, the diagram illustrates that the Crowsnest
Formation (volcanic sediments) is associated with a magnetic high,
suggesting that it contains minerals with relatively higher magnetic
susceptibilities than the surrounding rocks of the Blackstone Formation
and Blairmore Group. Consequently, this formation forms a "magnetic
marker bed" that may reveal the size and shape of folds at a consistent
stratigraphic level.
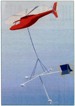
Helicopter-Mounted Systems
There are
benefits of using helicopter-mounted systems to acquire HRAM data. These
surveys are normally collected with 50- to 100-meter flight-line spacing
by a sensor hanging from a helicopter at a mean altitude of 30 meters (Figure
5).
The
helicopter-mounted system has the advantage of increased resolution as
well as the ability to perform draped surveys over rugged terrains --
however, the tight flight-line spacing requires that these surveys be
flown over site-specific areas, such as existing fields or prospective
regions.
In this
example, the helicopter-mounted system was flown over the Coleman gas
field in the WCSB's southern foothills, approximately 150 kilometers
south of Calgary (Figure 6). The Coleman
Field produces gas from fractured carbonates along the leading edge of
thrust sheets that are detached from the shallow structures outcropping
at the surface. The field is also located within a major structural
discontinuity known as the Vulcan Low.
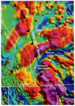
The
survey's objective was to identify faults that, due to their slight
offsets, could not be seen on seismic data but still compartmentalized
the reservoir. Figure 7 shows some of the
datasets used in the interpretation of the Coleman survey. These include
HRAM imagery, digital elevation model (DEM) data, and surface geological
information derived from published geology maps.
The
Figure 7 imagery illustrates that the
helicopter-mounted system produces a "smooth" magnetic image that is
generally not affected by the strong topographic relief present in the
Coleman area. The strongest anomalies visible in the HRAM data arise
from contrasts in the magnetic susceptibility of outcropping units.
These anomalies act as stratigraphic markers, outlining near-surface
geological structures found in the survey area.
The
internal geometry of anticlines and synclines is characterized by the
presence of several elongated and asymmetrical "magnetic ridges," which
reveal the attitude of inclined bedrock strata and outlines the location
of folds and plunging noses. The HRAM imagery also illustrates that
several magnetic markers are cut and offset by linear features, which
are believed to represent fault systems.
We
postulate that the major northeast-trending magnetic feature (A-A'),
which corresponds to the field's southern boundary, reflects late
reactivation of a major fault or zone of weakness in the basement. This
feature is coincident with a prominent gravity and magnetic low in the
basement referred to as the Vulcan Low (see
Figure 6), and as such, has been coined the Vulcan Low Fault Zone (VLFZ).
On the
other hand, the northwest-trending features (B-B') appear to reflect
shallow "tear faults" and do not correlate with deep-seated basement
structures. These faults seem to strongly affect the internal geometry
of the producing field. It is interesting to note that the latter fault
system appears to manifest subtle topographic expressions that can be
detected on the DEM imagery, suggesting recent motion along these
faults.
Because
HRAM surveys are strongly influenced by near-surface structures, they
are particularly useful in areas where the reservoir targets are located
within the upper thrust sheets, where there is significant correlation
between surface and subsurface structures. We have concluded that HRAM
data also can detect the presence of reactivated basement faults as well
as "tear faults." The recognition of these faults is crucial in
exploration, because they can either enhance the reservoir potential of
rock units or raise concern about the presence of structural
compartments within a targeted fold.
The
quality of HRAM surveys in rugged areas, however, may deteriorate due to
strong topographic effects, which are very difficult to remove with
current processing techniques. The best way to overcome this problem is
to collect data with helicopter-mounted systems. Although significantly
more expensive, these systems are flown while draping the landscape, and
as such, minimize the effect of topography.
Since the
1999 acquisition of the HRAM data over the Coleman Field, several
similar surveys have been collected over developed and undeveloped gas
fields in the Canadian Fold Belt region. In all cases, the
helicopter-mounted systems proved very useful to map near-surface
geological structures, which are nearly impossible to image with
conventional fixed-wing surveys due to strong topographic effects during
data collection.
The main
contribution of helicopter-borne HRAM data to exploration and
development activities is the detection of reactivated basement faults
and detached "tear faults" that have not previously been recognized
through conventional surface and subsurface mapping techniques. It must
be emphasized that these surveys only improve the recognition of
near-surface structures within the first kilometer below the surface.
Unfortunately, they do not provide significantly more information
regarding deep-seated structures, which can be detected with less
expensive conventional fixed-wing HRAM surveys.
References
MacLean, B.C.,
and D.G. Cook, 1999, Salt tectonism in the Fort Norman area, Northwest
Territories, Canada: Bulletin of Canadian Peroleum Geology, v. 47, p.
104-135. area, Northwest
Territories, Canada: Bulletin of Canadian Peroleum Geology, v. 47, p.
104-135.
Wheeler, J.O.,
and P. McFeely, 1991, Tectonic assemblage map of the Canadian
Cordillera: Geological Survey of Canada, Map 1712A.
Return to top.
|