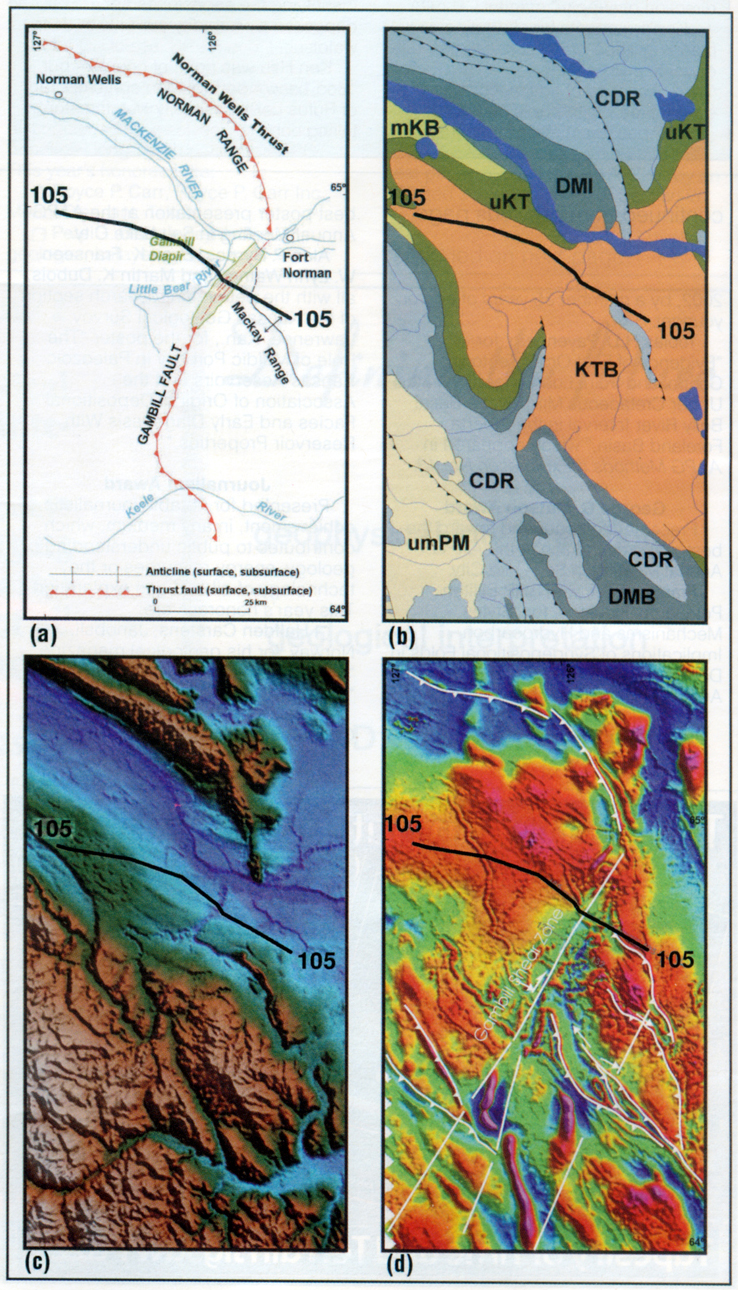
Figure 2. Interpretation of the Gambill Shear Zone in the Fort Norman area. (a) Simplified tectonic map of the Fort Norman area (from MacLean and Cook, 1999) (b) Surface geological map (Wheeler and McFeely, 1991). (c) Geological Survey of Canada (GSC) digital elevation model (DEM) derived from GSC HRAM survey. (d) GSC HRAM imagery with major tectonic elements. Note that the majority of magnetic anomalies show no correlation with topography. The location of seismic line 105 is displayed in the imagery.