Click on image for enlargement.
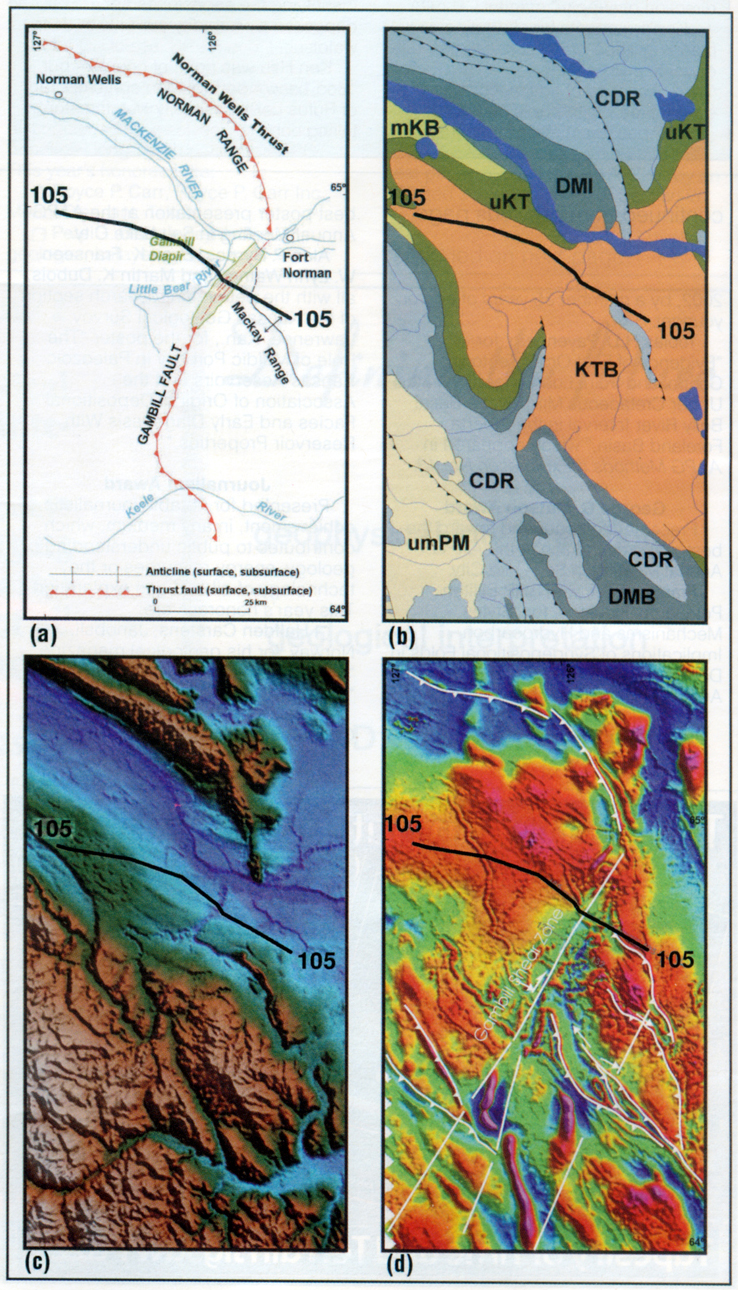
Figure 7. Interpretation of the HRAM survey over the Coleman area, showing: (a) HRAM imagery over the Coleman Field area; (b) Geological interpretation of the Coleman survey data; (c) Main structural features compiled from published GSC geology maps; (d) Digital elevation model (DEM) derived from the HRAM survey. The interpretation reveals that several magnetic marker beds can be used to outline folds and fracture patterns within the survey area. Basement (A-A') and near-surface (B-B') fault systems can be detected in the data. Comparison of the HRAM and DEM reveals that most of the magnetic features are not related to topography. VLFZ Vulcan Low Fault Zone.
Click to view sequence of maps of the Coleman area.