![]() Click to view page images in PDF format.
Click to view page images in PDF format.
Analog  Models
 of
Restraining Stepovers in Strike-Slip Fault Systems*
of
Restraining Stepovers in Strike-Slip Fault Systems*
Ken McClay,1 and Massimo Bonora2
Search and Discovery Article #40015, 2001
*Adapted for online presentation from article of same title by same authors published in AAPG Bulletin, V. 85, No. 2 (February 2001), p. 233-260.
1Fault Dynamics Research Group, Geology Department,
Royal Holloway University of London, Egham, Surrey TW20 OEX, United Kingdom;
email: [email protected]
2Midland Valley, 14 Park Circus, Glasgow, G3 6AX, Scotland, United
Kingdom
Scaled sandbox ![]() models
models![]() have successfully simulated the
geometries and progressive evolution of antiformal pop-up structures developed
in a weak sedimentary cover above restraining stepovers in offset sinistral
strike-slip fault systems in rigid basement.
have successfully simulated the
geometries and progressive evolution of antiformal pop-up structures developed
in a weak sedimentary cover above restraining stepovers in offset sinistral
strike-slip fault systems in rigid basement. ![]() Models
Models![]() were run both with and
without synkinematic sedimentation, which was added incrementally to cover the
growing antiformal structures. Vertical and
were run both with and
without synkinematic sedimentation, which was added incrementally to cover the
growing antiformal structures. Vertical and ![]() horizontal
horizontal![]() sections of the completed
sections of the completed
![]() models
models![]() permit the full three-dimensional (3-D) structure of the pop-ups to be
analyzed in detail. Three representative end-member experiments are described:
30° underlapping restraining stepovers; 90°
neutral restraining stepovers; and 150° overlapping restraining stepovers.
permit the full three-dimensional (3-D) structure of the pop-ups to be
analyzed in detail. Three representative end-member experiments are described:
30° underlapping restraining stepovers; 90°
neutral restraining stepovers; and 150° overlapping restraining stepovers.
The experimental pop-ups are typically sigmoidal to lozenge-shaped, antiformal structures having geometries that are dependent on both the stepover angle and stepover width in the underlying basement faults. Underlapping restraining stepovers typically form elongate lozenge-shaped pop-ups; 90° neutral restraining stepovers produce shorter, squat rhomboidal pop-ups; and overlapping restraining stepovers produce sigmoidal antiformal pop-ups. Trans pop-up cross fault systems are characteristic at large displacements on the basement fault system. Above the offset principal displacement zones, the pop-ups are commonly small, narrow, positive flower structures, whereas in the stepover region, they widen out and become markedly asymmetric. This pop-up asymmetry switches across the center of the stepover, where the pop-ups are largely symmetical. Maximum rotations measured within the central highly uplifted region of the pop-ups increase from 7° counterclockwise for the underlapping (30°) stepovers, to 14° counterclockwise for the neutral (90°) stepovers, to 16° counterclockwise for the overlapping (150°) stepovers.
In ![]() models
models![]() where no synkinematic sediments were added during
deformation, the pop-up structures are bound by convex, flattening-upward,
oblique-slip reverse fault systems that link downward to the offsets in the
basement fault system. In contrast, in the experiments where synkinematic
sediments were added incrementally during deformation, the pop-ups are formed by
oblique-slip reverse faults that steepen upward into the synkinematic strata
with the formation of fault-propagation growth folds.
where no synkinematic sediments were added during
deformation, the pop-up structures are bound by convex, flattening-upward,
oblique-slip reverse fault systems that link downward to the offsets in the
basement fault system. In contrast, in the experiments where synkinematic
sediments were added incrementally during deformation, the pop-ups are formed by
oblique-slip reverse faults that steepen upward into the synkinematic strata
with the formation of fault-propagation growth folds.
The analog ![]() models
models![]() are compared with natural examples of
pop-up structures and show strong similarities in structural geometries and
stratal architectures. These
are compared with natural examples of
pop-up structures and show strong similarities in structural geometries and
stratal architectures. These ![]() models
models![]() may provide structural templates for seismic
interpretation of complex contractional structures in offset strike-slip fault
systems.
may provide structural templates for seismic
interpretation of complex contractional structures in offset strike-slip fault
systems.

Click here for evolutionary sequence of a-e.
Click here for comparison of line diagram and photograph in Figure 3e.

Click here for evolutionary sequence of a-e.
Click here for comparison of line diagram and photograph in Figure 5e

Click here for evolutionary sequence of a-e.
Click here for comparison of line diagram and photograph in Figure 7e.
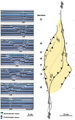
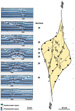
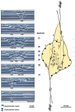
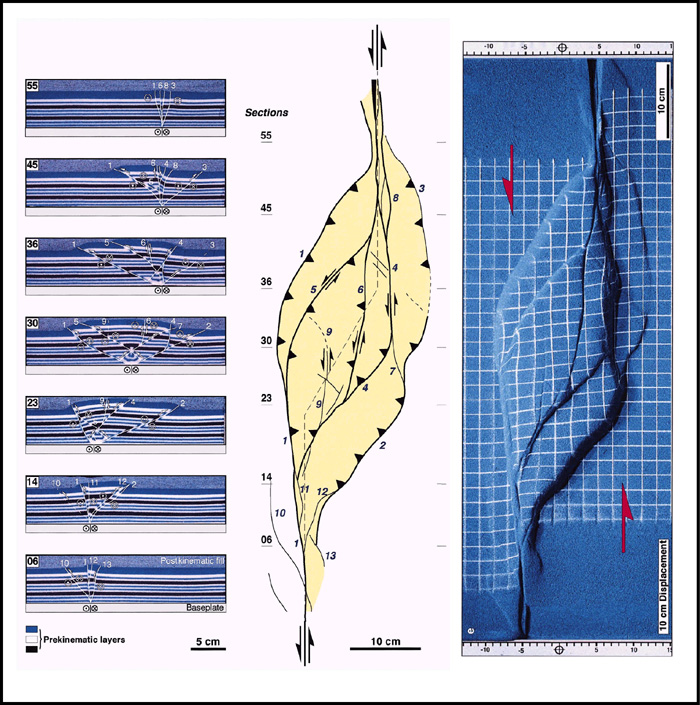
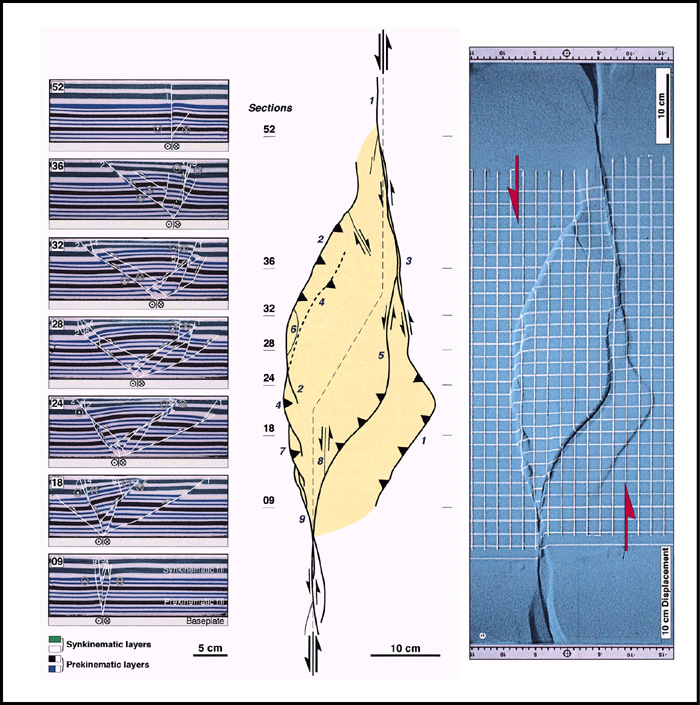
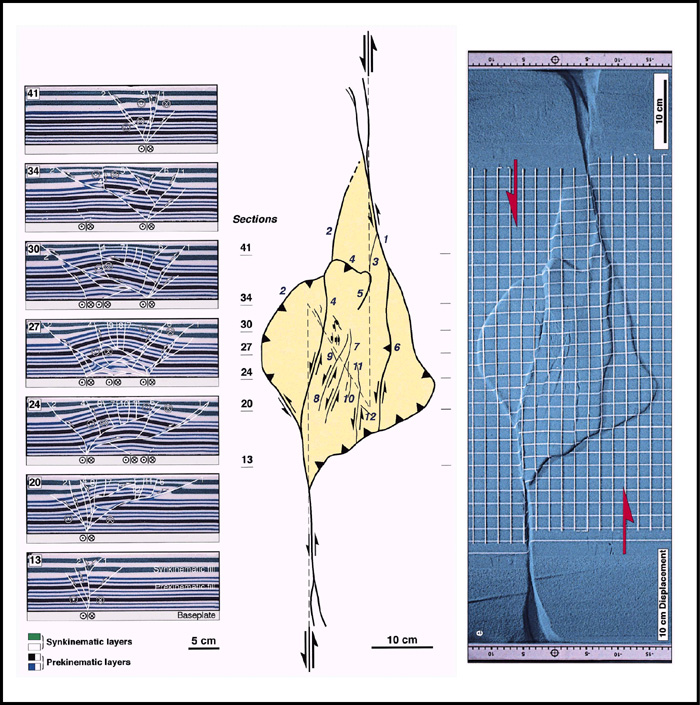
 Figure 9. Experiment W305 after 10 cm sinistral displacement. (a)
Top surface of model showing pop-up faults. (b)
Figure 9. Experiment W305 after 10 cm sinistral displacement. (a)
Top surface of model showing pop-up faults. (b) ![]() Horizontal
Horizontal![]() section taken 1 cm
below top surface. (c) Interpretation of b, showing the folds, faults,
and bed-dip directions.
section taken 1 cm
below top surface. (c) Interpretation of b, showing the folds, faults,
and bed-dip directions.
Click here for sequence of a-c.

Click here for evolutionary sequence of a, c, e.
Click here for comparison of line diagram and photograph in Figure 10e.

Click here for evolutionary sequence of a, c, e.
Click here for comparison of line diagram and photograph in Figure 12e.

Click here for evolutionary sequence of a, c, e.
Click here for comparison of line diagram and photograph in Figure 14e.
Click here for sequence of a-b.
Click here for sequence of underlapping stepover.
Click here for sequence of neutral stepover.
Click here for sequence of overlapping stepover.

Click here for sequence of landsat image and structural map.
 Figure
23. (a) Map of the Quealy pop-up, Laramie basin, Wyoming.
Structure contours are on top of the Lower Cretaceous Muddy sandstone, the
uppermost reservoir unit in the Quealy Dome oil field. Map after Stone (1995).
(b) Cross section AA' through the Quealy Dome structure. Modified (mirror image)
from Figure 6 of Stone (1995).
Figure
23. (a) Map of the Quealy pop-up, Laramie basin, Wyoming.
Structure contours are on top of the Lower Cretaceous Muddy sandstone, the
uppermost reservoir unit in the Quealy Dome oil field. Map after Stone (1995).
(b) Cross section AA' through the Quealy Dome structure. Modified (mirror image)
from Figure 6 of Stone (1995).
CLICK HERE for sequence showing fault patterns with underlapping to overlapping stepovers.
 Table
1.
Summary of experimental results.
Table
1.
Summary of experimental results.
Abstract
List of Illustrations
Contents
Introduction
Experimental Procedure
Experimental Results
Experiment Series: Without Synkinematic Sedimentation
Experiment Series: With Synkinematic Sedimentation
3-D Geometry and Variations in Stepover Width
Discussion
Pop-Up Geometries
Comparisons with Natural Examples of Pop-Up Structures
Example 1: Echo Hills, Southeastern Nevada
Example 2: Owl Creek Mountains, Central Wyoming
Example 3: Cerro de la Mica, Atacama Fault System, Northern Chile
Example 4: Pijnacker Field, West Netherlands
Example 5: Quealy Dome, Wyoming
Limitations of the Analog Models
Implications for Hydrocarbon Exploration
Conclusions
References Cited
Authors
Acknowledgments
Interpretation and analysis of complex three-dimensional (3-D) structures in the subsurface is one of the major challenges in hydrocarbon exploration. Seismic imaging of strike-slip structures is commonly very poor because of the steep stratal and fault dips as well as significant along-strike variations in structural geometries (cf. Harding, 1990; Sylvester, 1988). Scaled analog modeling has proved to be a powerful tool in developing an understanding of the geometries and kinematics of complex 3-D structures in sedimentary basins (e.g., extension structures: Withjack and Jamison, 1986; Serra and Nelson, 1989; McClay, 1990; Withjack et al., 1990; Tron and Brun, 1991; Vendeville, 1991; McClay, 1995a, b; McClay and White, 1995; contractional structures: Lallemand et al., 1992; Calassou et al., 1993; Malavieille et al., 1993; and strike-slip structures: Naylor et al., 1986; Mandl, 1988; Richard et al., 1989, 1991, 1995; Richard and Cobbold, 1990; Richard, 1991; Schreurs, 1994; McClay and Dooley, 1995; Dooley and McClay, 1997).
This article summarizes the results of a comprehensive suite
of experiments designed to simulate the geometric and kinematic evolution of
structures squeezed up at restraining bends and stepovers in strike-slip fault
systems; in this article these structures are termed "pop-ups" (cf.
Stone, 1995). In particular the ![]() models
models![]() have incorporated syntectonic
sedimentation during the deformation. This research is part of an ongoing
program designed to develop an understanding of the four-dimensional (4-D)
evolution of complex structures in sedimentary basins and follows an earlier
article on the modeling of strike-slip pull-apart basins (Dooley and McClay,
1997). The experimental results provide templates for seismic interpretation of
strike-slip pop-ups and insights into their kinematic evolution. The results of
the analog
have incorporated syntectonic
sedimentation during the deformation. This research is part of an ongoing
program designed to develop an understanding of the four-dimensional (4-D)
evolution of complex structures in sedimentary basins and follows an earlier
article on the modeling of strike-slip pull-apart basins (Dooley and McClay,
1997). The experimental results provide templates for seismic interpretation of
strike-slip pop-ups and insights into their kinematic evolution. The results of
the analog ![]() models
models![]() are compared and contrasted with natural examples of
structures developed in sedimetary strata above restraining bends or stepovers
in basement strike-slip fault systems.
are compared and contrasted with natural examples of
structures developed in sedimetary strata above restraining bends or stepovers
in basement strike-slip fault systems.
Pop-ups and transpressional uplifts are an integral part of intraplate and interplate strike-slip fault zones (Sylvester and Smith, 1976; Christie-Blick and Biddle, 1985; Sylvester, 1988; Zolnai, 1991) and form at restraining bends or stepovers (e.g., Harding, 1974, 1990; Christie-Blick and Biddle, 1985; Harding et al., 1985; Lowell, 1985). They typically form anticlinal uplifts, commonly with doubly plunging arrangements of folds, and are of limited strike extent. In plan view they are broadly lozenge-shaped to rhomboidal in form, whereas in cross section they commonly bounded convex-up faults that flatten upward toward the surface forming positive flower or palm tree structures (e.g., Sylvester and Smith, 1987; Sylvester, 1988). In this article we use the general term "pop-up" to describe a domal uplift (cf. Stone, 1995) that has both positive structural and topographic relief. Many large intraplate strike-slip systems, for example, along the San Andreas fault system (Harding, 1976; Sylvester and Smith, 1976; Sylvester, 1988; Brown and Sibson, 1989; Jones et al., 1994; Powell et al., 1993) or along the Altai fault system in Mongolia (Cunningham et al., 1996) commonly have large-scale pop-ups associated with restraining bends and stepovers.
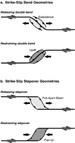
Bends and stepovers (jogs or offsets) in the principal displacement zones (PDZs)
(e.g., Christie-Blick and Biddle, 1985) of a strike-slip fault system generally
produce either zones of extension (pull-apart or stepover basins) at releasing
bends or stepovers (Figure 1a) or
regions of compression, uplifts, or pop-up structures (including positive
flower-palm tree structures) at restraining bends or restraining stepovers (Figure
1b). The latter characteristically produce anticlinal uplifts in the
overlying sedimentary section with older strata or basement exposed in the core
(e.g., Crowell, 1974; Sylvester and Smith, 1976; Mann et al., 1983; Aydin and
Nur, 1985; Christie-Blick and Biddle, 1985; Sylvester, 1988). Previous analog
model studies of pop-ups have not fully addressed their progressive evolution,
their 3-D structure, and in particular, their interaction with syntectonic
sedimentation (cf. sandbox ![]() models
models![]() in Horsefield, 1977, 1980; Naylor et al.,
1986; Mandl, 1988; Richard and Cobbold, 1990; Richard, 1991; Richard et al.,
1991; Schreurs, 1994; and Richard et al., 1995; and clay
in Horsefield, 1977, 1980; Naylor et al.,
1986; Mandl, 1988; Richard and Cobbold, 1990; Richard, 1991; Richard et al.,
1991; Schreurs, 1994; and Richard et al., 1995; and clay ![]() models
models![]() in Wilcox et
al., 1973; Keller et al., 1997). Here the results of a systematic series of
restraining stepover analog
in Wilcox et
al., 1973; Keller et al., 1997). Here the results of a systematic series of
restraining stepover analog ![]() models
models![]() are presented in 3-D and are compared with a
range of natural examples of in map and section view.
are presented in 3-D and are compared with a
range of natural examples of in map and section view.
The scaled analog ![]() models
models![]() were carried out using 5 and 10 cm
thick sandpacks in a 120 X 60 cm deformation rig (Figure
2). Thin aluminium base plates cut in such a way so as to produce
restraining strike-slip stepovers at angles from 30 to 150° (Figure
2) formed the offset fault system at the base of the model. Within the
deformation rig a homogeneous prekinematic sandpack was constructed by mechanically
sieving alternating 2-5 mm thick
were carried out using 5 and 10 cm
thick sandpacks in a 120 X 60 cm deformation rig (Figure
2). Thin aluminium base plates cut in such a way so as to produce
restraining strike-slip stepovers at angles from 30 to 150° (Figure
2) formed the offset fault system at the base of the model. Within the
deformation rig a homogeneous prekinematic sandpack was constructed by mechanically
sieving alternating 2-5 mm thick ![]() horizontal
horizontal![]()
![]() layers
layers![]() of white, blue (dyed), and
black (dyed), 190 µm grain size, dry quartz sand. Dry quartz sand deforms
according to Navier-Coulomb failure (Horsefield, 1977; McClay, 1990) and has
been widely used to simulate the brittle deformation of sediments in the upper
crust (e.g., Horsefield, 1977; Naylor et al., 1986; McClay, 1990; Schreurs,
1994; Richard et al., 1995; McClay and Dooley, 1995). The
of white, blue (dyed), and
black (dyed), 190 µm grain size, dry quartz sand. Dry quartz sand deforms
according to Navier-Coulomb failure (Horsefield, 1977; McClay, 1990) and has
been widely used to simulate the brittle deformation of sediments in the upper
crust (e.g., Horsefield, 1977; Naylor et al., 1986; McClay, 1990; Schreurs,
1994; Richard et al., 1995; McClay and Dooley, 1995). The ![]() models
models![]() have a model to
tectonic prototype scaling ratio of ~10-5 such that 1 cm in the
have a model to
tectonic prototype scaling ratio of ~10-5 such that 1 cm in the
![]() models
models![]() represents ~1 km in nature (cf. McClay, 1990).
represents ~1 km in nature (cf. McClay, 1990).
The baseplates of the model were displaced by computer-controlled stepper
motors such that they produced sinistral displacement at constant rate of 4 X 10⁻³
cm/sec. Prior to deformation, a 2 X 2 cm sand grid was placed on the upper
surface of the model in order that progressive displacements and rotations could
be monitored during the experiment. For the series of experiments incorporating
synkinematic sedimentation, green and white sand ![]() layers
layers![]() were added to completely
cover the pop-up structure after every 2 cm of total displacement on the
basement master faults. The upper surface of each experiment was recorded by
time-lapse photography at every 0.25 cm of displacement. Completed
were added to completely
cover the pop-up structure after every 2 cm of total displacement on the
basement master faults. The upper surface of each experiment was recorded by
time-lapse photography at every 0.25 cm of displacement. Completed ![]() models
models![]() were
impregnated with a gelling agent and serially sectioned both vertically and
horizontally for detailed analysis. Vertical sections were digitized into a
workstation for 3-D reconstruction using 3-D Move. Experiments were run at least
twice, enabling sectioning in different orientations. In all cases repeat
experiments produced similar results.
were
impregnated with a gelling agent and serially sectioned both vertically and
horizontally for detailed analysis. Vertical sections were digitized into a
workstation for 3-D reconstruction using 3-D Move. Experiments were run at least
twice, enabling sectioning in different orientations. In all cases repeat
experiments produced similar results.
The results of a comprehensive suite of experiments in which sinistral strike-slip faults in the rigid basement were offset at angles that varied from 30 to 150o in increments of 15o (cf. Figure 2) are presented. The width of the stepover was varied systematically from 2.5 to 10 cm, and the thickness of the prekinematic sandpack was varied from 5 to 10 cm. All experiments involved a total strike-slip displacement of 10 cm on the underlying basement master faults. One suite of experiments was run without the addition of synkinematic sedimentation, and the second suite with synkinematic sediments added incrementally throughout the deformation. In this article, representative results from these two groups of experimental results are shown for basement fault restraining stepover widths of 10 cm and prekinematic sandpack thicknesses of 5 cm. The stepover geometries used were 30° underlapping stepover, 90° neutral stepover, and 150° overlapping stepover (these angles are measured between the strike of the main fault segments and the line joining the tips of these faults in the stepover region, e.g., Figure 2).
The results from key representative stepover ![]() models
models![]() are
presented in the following section and summarized in Table
1. For this article,
are
presented in the following section and summarized in Table
1. For this article, ![]() models
models![]() having a sandpack thickness of 5 cm were chosen
because they produced pop-ups that had more than one set of oblique reverse
faults, as well as well defined internal structures.
having a sandpack thickness of 5 cm were chosen
because they produced pop-ups that had more than one set of oblique reverse
faults, as well as well defined internal structures. ![]() Models
Models![]() having 10 cm thick
sandpacks produced comparatively simple pop-ups bounded by only two oblique-slip
reverse faults and with little internal structure.
having 10 cm thick
sandpacks produced comparatively simple pop-ups bounded by only two oblique-slip
reverse faults and with little internal structure.
Experiment Series 1: Without Synkinematic Sedimentation
30° Underlapping Restraining Stepover
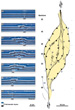
After 1-2 cm sinistral strike-slip displacement on the basement faults, experiment W306 produced an initial broad zone of uplift localized above the basement stepover (Table 1; Figure 3a). The uplift was bounded by two sinistral, oblique reverse fault segments (Figure 3a). At 2 cm displacement, well-defined sinistral oblique-slip Riedel shears appeared above the main strands of the basement faults (Figure 3a). The central part of the model showed 5° counterclockwise rotation at this stage. With increased displacement, these Riedel shears link into an anastomosing array of faults that form the principal displacement zones (PDZs) in the sandpack. At 4 cm displacement, the pop-up structure is well defined, having two sets of reverse faults defining a rhomboidal uplift (Figure 3b). The outer pair of reverse faults defined the extremities of the uplift, and the internal pair of faults defined an inner zone of greater relief. At this stage, the maximum rotation of the central section of the model had increased slightly to 6°. >From 4 to 6 cm displacement, the uplift increased in amplitude, and deformation was mainly focused in the central part of the model. By 8 cm displacement a pair of oblique-slip, sinistral strike-slip faults cut across the central region of the pop-up and linked the two PDZs at each end of the model (Table 1; Figure 3d). The final structure after 10 cm of displacement consisted of an elongate, deformed rhomboidal pop-up in which the cross faults linked the two PDZs and concentrated much of the late stage displacement (Figure 3e). Maximum rotation of the central part of the pop-up was only 7° counterclockwise.
Vertical serial sections through the completed model (Figure 4) show the along-strike change in symmetry within the model. In the sandpack beyond the extremities of the basement stepover, the PDZs form positive flower or palm tree structures that become asymmetric toward the basement stepover. The asymmetric pop-ups are formed by one steeply dipping reverse fault and by one more shallowly dipping oblique reverse fault (Figure 4). The sense of asymmetry switches across the center of the stepover (Figure 4). At the center of the stepover in the basement faults, the pop-up is symmetric and bounded on each side by divergent reverse faults (section 30 in Figure 4). The opposing asymmetries of the pop-ups at either end of the stepover reflect the decrease in along-strike displacement on the outer oblique reverse faults (Figure 4). The steep crosscutting strike-slip faults that link the PDZs appear to cut the earlier formed lower angle convex-up reverse faults that define the dominant asymmetric positive flower structure of the pop-up (Figure 4).
90° Neutral Restraining Stepover
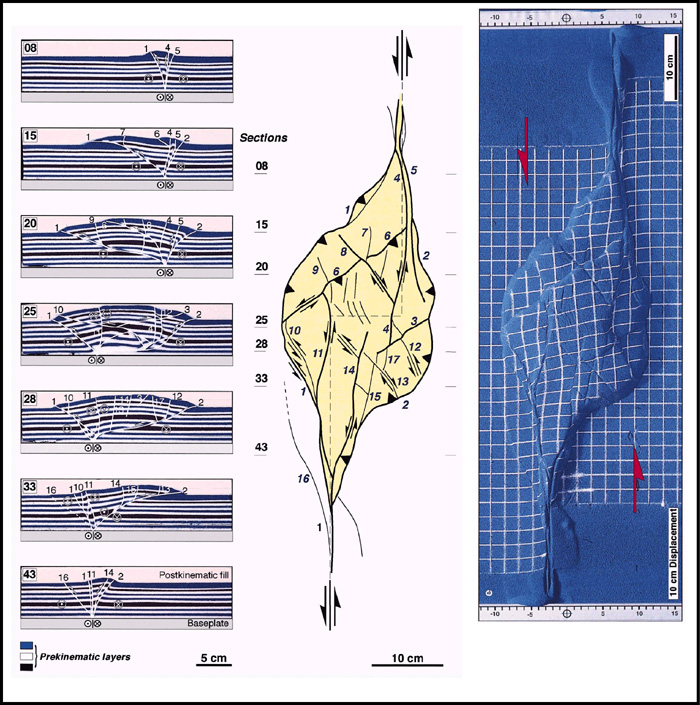
Experiment W303, a 90° neutral restraining stepover, displayed a similar evolution to the 30° model described previously. A rhomboidal to slightly sigmoidal pop-up structure bounded by curved, oblique-slip reverse faults formed above the basement stepover (Table 1; Figure 5). The main differences in the evolution of this model were the shorter pop-up and the increased rotation and the development of small displacement antithetic, dextral shears in the central region of the pop-up (Table 1; Figure 5). In cross section the pop-up shows a distinct asymmetry, the sense of which switches across the center of the basement stepover (Figure 6).
150° Overlapping Restraining Stepover
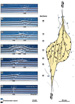
Experiment W309, a 150° overlapping restraining
stepover, displayed a similar evolution to the ![]() models
models![]() previously described but
developed a strongly sigmoidal pop-up structure bounded by curved, oblique-slip
reverse faults above the basement stepover (Table
1; Figure 7). This model also
displayed increased rotation (16o after 10 cm of displacement) (Table
1) and the development of small displacement dextral and sinistral shears in
the central region of the pop-up (Table
1; Figure 7). As in the other
previously described but
developed a strongly sigmoidal pop-up structure bounded by curved, oblique-slip
reverse faults above the basement stepover (Table
1; Figure 7). This model also
displayed increased rotation (16o after 10 cm of displacement) (Table
1) and the development of small displacement dextral and sinistral shears in
the central region of the pop-up (Table
1; Figure 7). As in the other
![]() models
models![]() described previously, the cross sections of the pop-up show a distinct
asymmetry, which switches across the center of the basement stepover (Figure
8).
described previously, the cross sections of the pop-up show a distinct
asymmetry, which switches across the center of the basement stepover (Figure
8).
In addition to vertical serial sections, some ![]() models
models![]() were
sectioned horizontally to analyze the geometry at depth. Figure
9 shows the top-surface geometry and a
were
sectioned horizontally to analyze the geometry at depth. Figure
9 shows the top-surface geometry and a ![]() horizontal
horizontal![]() section, at 2.5 cm below
the crest of the pop-up, through experiment W305, a 90° neutral restraining stepover. The
rhomboidal shape is clearly delineated together with the two pairs of sigmoidal,
oblique-slip reverse faults that bound the inner and outer parts of the uplifted
area. Note also the doubly plunging anticlinal nature of the pop-up with the
main anticlinal axis that strikes counter to the overall sinistral shear
displacement of the main fault systems (Figure
9c). The inner set of reverse faults defines a zone of greater uplift. The
cross pop-up strike-slip faults that are seen on the upper surface of the model
(Figure 9a) have sigmoidal traces
in the
section, at 2.5 cm below
the crest of the pop-up, through experiment W305, a 90° neutral restraining stepover. The
rhomboidal shape is clearly delineated together with the two pairs of sigmoidal,
oblique-slip reverse faults that bound the inner and outer parts of the uplifted
area. Note also the doubly plunging anticlinal nature of the pop-up with the
main anticlinal axis that strikes counter to the overall sinistral shear
displacement of the main fault systems (Figure
9c). The inner set of reverse faults defines a zone of greater uplift. The
cross pop-up strike-slip faults that are seen on the upper surface of the model
(Figure 9a) have sigmoidal traces
in the ![]() horizontal
horizontal![]() section (Figure 9b)
and link to the main PDZs at either end of the stepover structure. The synthetic
and antithetic Riedel shears that are observed on the surface of the model (Figure
9a) are not found in the
section (Figure 9b)
and link to the main PDZs at either end of the stepover structure. The synthetic
and antithetic Riedel shears that are observed on the surface of the model (Figure
9a) are not found in the ![]() horizontal
horizontal![]() section, indicating their limited slip
and relatively late stage of development.
section, indicating their limited slip
and relatively late stage of development.
Experiment Series 2: With Synkinematic Sedimentation
In this series of experiments, synkinematic sedimentation
was added at the end of each increment of deformation burying the pop-ups and
preventing the development of steep surface scarps above emergent fault
surfaces. The photographs of the top surfaces of the ![]() models
models![]() at each stage of the
deformation therefore show the effects of the last deformation increment in the
synkinematic layer.
at each stage of the
deformation therefore show the effects of the last deformation increment in the
synkinematic layer.
30° Underlapping Restraining Stepover
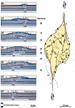
After 1-2 cm of sinistral strike-slip displacement on the
basement faults, synthetic Riedel shears formed above the offset segments of
these faults together with a wide zone of gentle uplift above the basement
stepover (Figure 10a). This
uplift zone was bound by two weakly developed oblique-slip reverse faults, which
with increased displacement, propagated along strike and formed sigmoidal
linkages to the main PDZs (Figure
10b). At 4 cm of displacement a second set of sinistral, oblique-slip
reverse faults formed at the extremities of the uplifted area. At this stage (Figure
10b), the internal pair of reverse faults defined an inner zone of greater
relief, similar to that in the ![]() models
models![]() without synkinematic sedimentation (cf. Figure
3). After 6 cm displacement (Figure
10c), activity on the inner right-hand oblique reverse fault ceased, and
much of the late-stage displacement focused on the remaining faults (Figure
10d), forming an elongate deformed rhomboidal pop-up. This was also the
geometry of the final structure after 10 cm displacement (Figure
10e). Trans pop-up oblique sinistral strike-slip faults do not appear to cut
the structure. The rotations of the marker grid on the upper surface of the
model are only very small (Figure 10),
decreasing from 5° counterclockwise rotation at 2 cm
displacement to only 1.5 to 2° rotation for each 2 cm deformation
increment thereafter (Table 1).
without synkinematic sedimentation (cf. Figure
3). After 6 cm displacement (Figure
10c), activity on the inner right-hand oblique reverse fault ceased, and
much of the late-stage displacement focused on the remaining faults (Figure
10d), forming an elongate deformed rhomboidal pop-up. This was also the
geometry of the final structure after 10 cm displacement (Figure
10e). Trans pop-up oblique sinistral strike-slip faults do not appear to cut
the structure. The rotations of the marker grid on the upper surface of the
model are only very small (Figure 10),
decreasing from 5° counterclockwise rotation at 2 cm
displacement to only 1.5 to 2° rotation for each 2 cm deformation
increment thereafter (Table 1).
Serial vertical sections across the final structure revealed the internal geometry of the pop-up (Figure 11). At the extremities of the pop-up structure, the narrow positive flower structures developed above both PDZs (Figure 11). The pop-up structure itself is characterized by distinctly asymmetric positive flower structures that switch polarities along strike (Figure 11). The positive flower structures are formed by oblique-slip reverse faults that are planar in the prekinematic strata and steepen upward in the synkinematic strata (Figure 11). The structure above the center of the basement stepover was symmetric, and the uplift was bounded on each side by two divergent reverse faults (Section 28 in Figure 11). Thickness changes in the synkinematic strata occurred where they thinned onto the hanging walls of the oblique-slip reverse faults forming fault-propagation growth folds (Figure 11).
90° Neutral Restraining Stepover
A similar progressive deformation pattern was exhibited by experiment W314, a 90° restraining stepover (Table 1; Figure 12). In contrast to experiment W324 (30° stepover) the pop-up was much broader and bounded by sigmoidal oblique reverse faults (Figure 12). Two trans pop-up cross faults cut the center of the uplifted area and linked to the offset PDZs. In the latter deformation stages, these sinistral faults accommodated much of the displacement (Figure 12d). In addition small displacement dextral shears were also developed in the center of the model during the late stages of deformation (Figure 12c-e). For each increment of deformation the maximum counterclockwise (i.e., sinistral) rotation of the marker grid lines was 2 to 3.5° (Table 1; Figure 12).
Serial vertical sections across the completed model revealed symmetric to slightly asymmetric positive flower structures formed along the main strands of the PDZs (Figure 13). The central section of the pop-up is symmetric and bound by moderately dipping, oblique-slip, concave-up reverse faults. The central part of the pop-up structure was also cut by well-developed cross faults (Section 19 in Figure 13). The synkinematic sediments thinned onto the crest of the pop-up and prevented the active faults from flattening out upsection toward the free upper surface of the model.
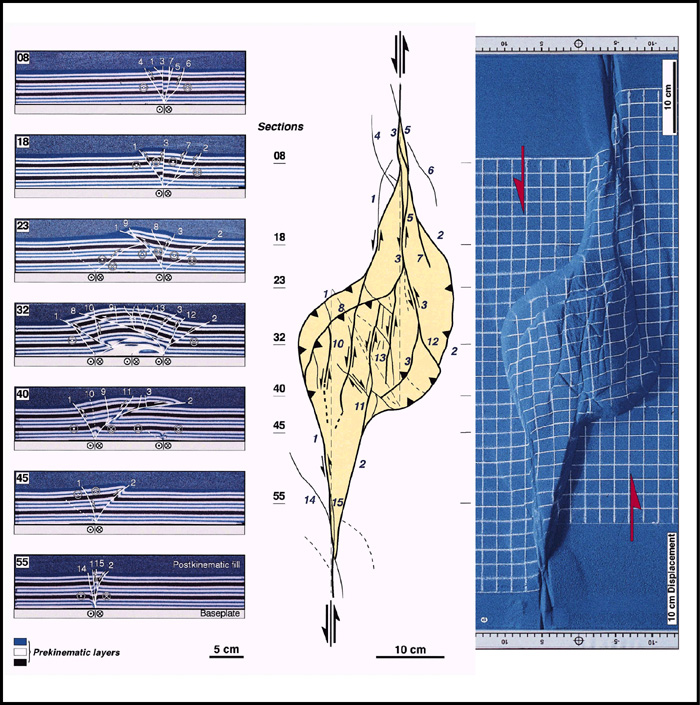
150° Overlapping Restraining Stepover
Experiment W325, 150° stepover, showed a similar evolution to model W314 (cf. Table 1; Figure 14) with the development of a strongly sigmoidal pop-up, the central section of which was cut by several sinistral cross faults (Figure 14). These cross faults were very distinct in the vertical sections (sections 24-30; Figure 15). For the initial two 2 cm increments of deformation (Figure 14), the maximum counterclockwise rotation of the grid lines was 4-5°, decreasing to 2° thereafter. As in all experiments, the pop-up was distinctly asymmetric either side of the central section of the basement stepover.
3-D Geometry and Variations in Stepover Width
In all of the experiments described previously and
summarized in Table 1, the
stepover width was fixed at 10 cm. Reduction of the stepover width to 5 cm
reduced the width of the resultant pop-up and for the same amount of
displacement on the basement fault system produced pop-ups having more uplift
and greater complexity of internal structure (Figure
16; experiment W307, 90° neutral stepover; Figure
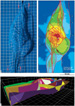
17, see following section). Structure contours on top of the prekinematic
surface for this model clearly revealed the strongly elevated core of the
pop-up, the dissected nature of this central part, and the elongated rhomboidal
nature of the whole structure. The complexity of internal faulting in this model
was revealed by 3-D reconstruction using 3-D Move, where a perspective view of
the faults was generated (Figure 16c).
This clearly showed the sigmoidal shape of the oblique-bounding faults of the
pop-up and the crosscutting faults in the center of the structure. As in most of
the ![]() models
models![]() constructed in this experimental program, all the faults that bound
the pop-up structure root downward into the offset linear faults at the base of
the model (Figure 16c). The
asymmetry characteristic of the pop-ups produced in these experiments was
produced by the changing 3-D geometry of the primary oblique reverse faults that
link the offset PDZs.
constructed in this experimental program, all the faults that bound
the pop-up structure root downward into the offset linear faults at the base of
the model (Figure 16c). The
asymmetry characteristic of the pop-ups produced in these experiments was
produced by the changing 3-D geometry of the primary oblique reverse faults that
link the offset PDZs.
In experiments where the width of the stepover was varied from 10 to 2.5 cm (summarized in Figure 17), a decrease in the stepover width produced a proportional decrease in the width of the pop-up and a corresponding increase in the surface relief of the pop-up, as the total displacement remained constant. Having stepover widths less than half of the total displacement along the master faults, underlapping and neutral basement configurations produced structures that can be best described as in-line uplifts (the axis of uplift closely parallels the PDZ) (Figure 17g, h) and only extreme overlap such as that in the 150° configuration produces a rhombic-shaped pop-up (Figure 17i).
The experimental ![]() models
models![]() of strike-slip pop-ups in this
article reveal their progressive evolution in plan view and their 3-D structure
in both vertical and
of strike-slip pop-ups in this
article reveal their progressive evolution in plan view and their 3-D structure
in both vertical and ![]() horizontal
horizontal![]() sections (e.g., Figures
3-9, 16). The geometries of
restraining stepover pop-ups were fundamentally controlled by the geometry of
the stepover (underlapping-overlapping), the width of the stepover in the rigid
basement beneath the sandpack (Figures
3-9, 16), and the thickness
of the sandpack.
sections (e.g., Figures
3-9, 16). The geometries of
restraining stepover pop-ups were fundamentally controlled by the geometry of
the stepover (underlapping-overlapping), the width of the stepover in the rigid
basement beneath the sandpack (Figures
3-9, 16), and the thickness
of the sandpack.
In ![]() models
models![]() without synkinematic sedimentation, the finite pop-up geometries
varied from elongate lozenge-shaped uplifts for 30° underlapping stepovers (Figures
3, 16), to broad
rhomboidal shapes for 90° stepovers (Figures
5, 9, 13),
to sigmoidal shapes for 150°
overlapping stepovers (Figures 7,
15). All pop-ups are
characterized by doubly plunging anticlines that produce four-way dip closures
above the restraining stepover (Figures
9, 16). Having an increase
in the amount of stepover, the pop-ups became wider, more sigmoidal, and
developed crosscutting faults that linked the offset PDZs (Figures
5, 7, 9).
In some
without synkinematic sedimentation, the finite pop-up geometries
varied from elongate lozenge-shaped uplifts for 30° underlapping stepovers (Figures
3, 16), to broad
rhomboidal shapes for 90° stepovers (Figures
5, 9, 13),
to sigmoidal shapes for 150°
overlapping stepovers (Figures 7,
15). All pop-ups are
characterized by doubly plunging anticlines that produce four-way dip closures
above the restraining stepover (Figures
9, 16). Having an increase
in the amount of stepover, the pop-ups became wider, more sigmoidal, and
developed crosscutting faults that linked the offset PDZs (Figures
5, 7, 9).
In some ![]() models
models![]() , small, antithetic (dextral) shears also cut the crests of the
pop-ups. The addition of synkinematic sedimentation produced broader structures
(Figures 10, 12,
14) as the sidewall bounding
faults to the pop-up propagated upward through the synkinematic
, small, antithetic (dextral) shears also cut the crests of the
pop-ups. The addition of synkinematic sedimentation produced broader structures
(Figures 10, 12,
14) as the sidewall bounding
faults to the pop-up propagated upward through the synkinematic ![]() layers
layers![]() rather
than flattening at the surface as in the
rather
than flattening at the surface as in the ![]() models
models![]() that had no synkinematic
sedimentation. A decrease in the width of the stepover produced narrower pop-ups
(Figure 17), but they had more
complex internal structures (Figure
16). As in all sand analog
that had no synkinematic
sedimentation. A decrease in the width of the stepover produced narrower pop-ups
(Figure 17), but they had more
complex internal structures (Figure
16). As in all sand analog ![]() models
models![]() , the fault density decreases as sandpack
thickness increases, such that 10 cm sandpacks generated relatively simple broad
pop-up.
, the fault density decreases as sandpack
thickness increases, such that 10 cm sandpacks generated relatively simple broad
pop-up. ![]() Models
Models![]() run that had stepover widths of less than 50% total displacement
produced narrow, in-line uplifts for underlapping to neutral baseplate
configurations.
run that had stepover widths of less than 50% total displacement
produced narrow, in-line uplifts for underlapping to neutral baseplate
configurations.
In vertical sections (cf. Figures
4, 6, 8),
the PDZs at the extremities of the ![]() models
models![]() were characterized by narrow positive
flower structures. Deformation in the stepover consisted of strongly asymmetric
pop-ups, except in their very centers, where broad symmetric pop-ups were
formed. In most
were characterized by narrow positive
flower structures. Deformation in the stepover consisted of strongly asymmetric
pop-ups, except in their very centers, where broad symmetric pop-ups were
formed. In most ![]() models
models![]() , two pairs of oblique-slip reverse sidewall faults bound
the pop-up. The inner fault pair produced a central zone of greater uplift and
surface relief (Figures 3e, 5e,
7e). For
, two pairs of oblique-slip reverse sidewall faults bound
the pop-up. The inner fault pair produced a central zone of greater uplift and
surface relief (Figures 3e, 5e,
7e). For ![]() models
models![]() without
synkinematic sedimentation, the bounding faults to the pop-ups are very steep,
having dips ³75° in the basal
parts of the model and flatten upward toward the free upper surface, giving a
general convex-up fault profile.
without
synkinematic sedimentation, the bounding faults to the pop-ups are very steep,
having dips ³75° in the basal
parts of the model and flatten upward toward the free upper surface, giving a
general convex-up fault profile. ![]() Models
Models![]() having synkinematic sedimentation
typically produced pop-up faults that were gently concave upward (Figures
11, 13, 15)
in cross section as a result of propagation through the synkinematic
having synkinematic sedimentation
typically produced pop-up faults that were gently concave upward (Figures
11, 13, 15)
in cross section as a result of propagation through the synkinematic ![]() layers
layers![]() producing fault-propagation growth folds. The synkinematic strata thinned onto
the crest of the pop-up anticlines and thickened away from them (Figures
11, 13, 15).
producing fault-propagation growth folds. The synkinematic strata thinned onto
the crest of the pop-up anticlines and thickened away from them (Figures
11, 13, 15).
The upper surfaces of the pop-ups showed counterclockwise (sinistral)
rotation indicated by the deformation of the grid lines on the surface of the
![]() models
models![]() . The maximum rotation, after 10 cm displacement on the basement fault
system, increased from only 7-7.5° counterclockwise for the 30°
underlapping stepover (Figure 3),
to 12-14° for the 90° neutral stepover (Figure
5); to 16°
for the 150° overlapping stepover (Figure
7). The same pattern of increased rotation was observed for strike-slip
pull-apart
. The maximum rotation, after 10 cm displacement on the basement fault
system, increased from only 7-7.5° counterclockwise for the 30°
underlapping stepover (Figure 3),
to 12-14° for the 90° neutral stepover (Figure
5); to 16°
for the 150° overlapping stepover (Figure
7). The same pattern of increased rotation was observed for strike-slip
pull-apart ![]() models
models![]() (Dooley and McClay, 1997) and reflect the increasing
difficulty of displacement transfer across the stepover with increased amount of
stepover ( i.e., 30 to 90°
to 150°).
These rotations, however, are relatively small compared with those that might be
expected in block-fault rotational strike-slip
(Dooley and McClay, 1997) and reflect the increasing
difficulty of displacement transfer across the stepover with increased amount of
stepover ( i.e., 30 to 90°
to 150°).
These rotations, however, are relatively small compared with those that might be
expected in block-fault rotational strike-slip ![]() models
models![]() (cf. McKenzie and Jackson,
1986) and those that are observed in complex restraining stepover systems along
the San Andreas fault system in southern California (cf. 37 to 85°)
(Dickinson, 1996; Sylvester, 1988). This most likely reflects the isotropic
nature of the sandpack in the
(cf. McKenzie and Jackson,
1986) and those that are observed in complex restraining stepover systems along
the San Andreas fault system in southern California (cf. 37 to 85°)
(Dickinson, 1996; Sylvester, 1988). This most likely reflects the isotropic
nature of the sandpack in the ![]() models
models![]() , and larger rotations might be expected if
competency contrasts and anisotropies were introduced into the
, and larger rotations might be expected if
competency contrasts and anisotropies were introduced into the ![]() models
models![]() .
.
Figure 18 is a 3-D synoptic
model of the fundamental pop-up architecture as seen in the analog ![]() models
models![]() . This
illustrates the curved nature of the primary sidewall reverse faults and the
change in their geometries along strike. The pop-up asymmetry is generated as
the bounding faults change from strike-slip to oblique reverse-slip along strike
and as they link to the PDZs at the ends of the stepovers.
. This
illustrates the curved nature of the primary sidewall reverse faults and the
change in their geometries along strike. The pop-up asymmetry is generated as
the bounding faults change from strike-slip to oblique reverse-slip along strike
and as they link to the PDZs at the ends of the stepovers.
Comparisons with Natural Examples of Pop-Up Structures
Many strike-slip fault systems are strongly segmented (e.g.,
the San Andreas system) (Jones et al., 1994; Peters et al., 1994; Zolnai, 1991;
Sylvester, 1988; Powell et al., 1993), having thrust faults and anticlinal
uplifts formed in regions of restraining stepovers in the fault system.
Well-described natural examples of pop-ups are uncommon, probably because of the
complex 3-D geometries of the fault systems and also because they are regions of
uplift and, once formed, rapidly become eroded. Sylvester and Smith (1976)
described complex palm tree structures: pop-up features having flattening upward
reverse faults from the Mecca Hills region of the San Andreas fault system,
southern California. Cunningham et al. (1996) interpreted several short,
elevated mountain ranges along the North Gobi-Altai fault zone to have formed
above restraining bends and stepovers in this sinistral strike-slip fault
system. These mountain ranges have broad, doubly plunging antiformal shapes and
are bounded by steep reverse faults. Their general form and topographic
morphology are similar to that produced in the analog ![]() models
models![]() described in this
article. Natural pop-ups that show similar morphologies and structures to the
analog
described in this
article. Natural pop-ups that show similar morphologies and structures to the
analog ![]() models
models![]() are briefly discussed in the following section.
are briefly discussed in the following section.
Example 1: Echo Hills, Southeastern Nevada
The Echo Hills formed in a restraining stepover in the
Bitter Spring Valley fault zone, north of Lake Mead, Nevada. The topography and
fault patterns (Figure 19) as
mapped by Campagna and Aydin (1991) show a rhomboidal zone of uplift that is
bounded by steep reverse faults. The center of the uplifted block is cut by
sinistral strike-slip faults that link the two PDZs (Figure
19). The structure of this pop-up is similar to the analog ![]() models
models![]() and the
map is most comparable to the surface views of the 30° restraining stepover
and the
map is most comparable to the surface views of the 30° restraining stepover ![]() models
models![]() (cf. Figures
3, 4, 10).
(cf. Figures
3, 4, 10).
Example 2: Owl Creek Mountains, Central Wyoming
The Owl Creek pop-up, central Wyoming (Paylor and Yin,
1993), formed in the stepover between the steeply dipping North Owl Creek fault
in the northwest and the Shotgun Butte thrust system in the southeast (Figure
20). The Owl Creek structure consists of three dominant
northwest-southeast-trending anticlines involving Precambrian through Permian
rocks (Paylor and Yin, 1993) forming a complex pop-up structure. Its lozenge
shape and map expression is similar to the patterns produced by the underlapping
restraining stepover ![]() models
models![]() (Figures
3, 4, 10).
(Figures
3, 4, 10).
Example 3: Cerro de la Mica, Atacama Fault System, Northern Chile
Cerro de la Mica, is a short, isolated range of uplifted
Paleozoic volcanic and sedimentary rocks along the northern Atacama fault zone (Figure
21). Cerro de la Mica occurs at the stepover between two segments of the
Jurassic-Cretaceous sinistral northern Atacama fault zone. The range is 800 m
above base level, elongate, and bounded by steep reverse faults on each side.
The internal structure is complex and has steeply dipping Paleozoic volcanic and
sedimentary rocks (Figure 21b).
The morphology and fault architecture of the Cerro del Mica is comparable to our
experimental ![]() models
models![]() where the restraining stepover was oriented at 30°
(e.g., Figures 3, 4,
10).
where the restraining stepover was oriented at 30°
(e.g., Figures 3, 4,
10).
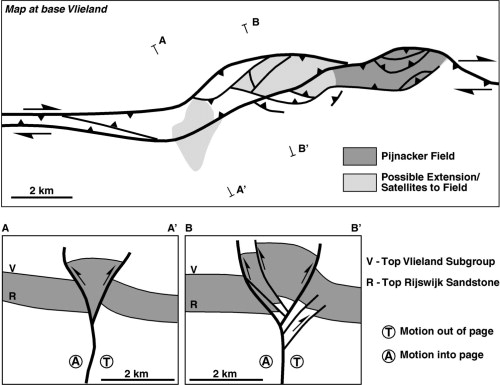
Example 4: Pijnacker Field, West Netherlands
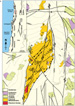
The Pijnacker field (Figure 22) is located at a right-stepping, restraining offset in a northwest-southeast-trending dextral strike-slip fault system (Racero-Baema and Drake, 1996). The field is located in an elongate lozenge-shaped pop-up that formed by inversion of an older rhomboidal pull-apart as a result of early Tertiary reversal of slip on the northwest-southeast boundary faults. The pop-up is bounded by concave-up reverse faults that produce an elongate S-shaped anticlinal structure (Figure 22). In this case the plan geometry of the pop-up indicates that the controlling faults were offset in an underlapping stepover geometry (cf. Figures 3, 5). The reservoir unit in this oil field is the Rijswijk sandstone (Racero-Baema and Drake, 1996).
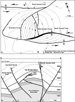
Example 5: Quealy Dome, Wyoming
The Quealy dome (Figure
23) is formed between two northeast-trending, basement-involved, sinistral
strike-slip faults in the Laramie basin, Wyoming (Stone, 1995). The pop-up
formed between the North Quealy and South Quealy fault systems, 3.2 km apart (Figure
23a), and is characterized by an asymmetric dome bounded by gently
concave-up thrust faults (Overland thrust and West Quealy thrust) (Figure
23). The map and cross sectional geometry of the Quealy pop-up closely
matches the architecture of the 90o neutral stepover ![]() models
models![]() (Figures
5, 6) and, in particular, the
map pattern is very similar to the
(Figures
5, 6) and, in particular, the
map pattern is very similar to the ![]() horizontal
horizontal![]() section of model W305 (Figure
9b).
section of model W305 (Figure
9b).
Limitations of the Analog ![]() Models
Models![]()
The geometries and kinematics of pop-up structures developed
at retraining bends and stepovers in strike-slip fault systems can be
successfully simulated using analog ![]() models
models![]() as described previously. Important
limitations to sandbox modeling, however, must always be considered when
applying the results to studies of natural fault systems. Sandbox
as described previously. Important
limitations to sandbox modeling, however, must always be considered when
applying the results to studies of natural fault systems. Sandbox ![]() models
models![]() cannot
accurately simulate the thermal, flexural, and isostatic effects generated by,
or associated with, faulting in the upper crust, nor do they consider the
effects of pore-fluid pressures and compaction. Pure sand
cannot
accurately simulate the thermal, flexural, and isostatic effects generated by,
or associated with, faulting in the upper crust, nor do they consider the
effects of pore-fluid pressures and compaction. Pure sand ![]() models
models![]() , such as those
described in this article, are isotropic, whereas in natural systems, the upper
crustal strata would be expected to exhibit competency contrasts and
anisotropies that would affect the fault geometries and in particular the
development of folds and rigid block rotations. Natural pop-ups such as the Owl
Creek (Figure 20) and the
Ocotillo Badlands structures (Brown and Sibson, 1989) are strongly folded as a
result of anisotropic
, such as those
described in this article, are isotropic, whereas in natural systems, the upper
crustal strata would be expected to exhibit competency contrasts and
anisotropies that would affect the fault geometries and in particular the
development of folds and rigid block rotations. Natural pop-ups such as the Owl
Creek (Figure 20) and the
Ocotillo Badlands structures (Brown and Sibson, 1989) are strongly folded as a
result of anisotropic ![]() layers
layers![]() in the stepover structure. In particular the
in the stepover structure. In particular the ![]() models
models![]() presented in this article do not incorporate plastic or ductile
presented in this article do not incorporate plastic or ductile ![]() layers
layers![]() designed
to simulate weak rocks such as salt or overpressured shale. Nevertheless, the
usefulness of the analog
designed
to simulate weak rocks such as salt or overpressured shale. Nevertheless, the
usefulness of the analog ![]() models
models![]() in understanding the progressive evolution of
strike-slip pop-ups is demonstrated by the strong geometric similarities between
the
in understanding the progressive evolution of
strike-slip pop-ups is demonstrated by the strong geometric similarities between
the ![]() models
models![]() and the natural examples described previously.
and the natural examples described previously.
Implications for Hydrocarbon Exploration
Strike-slip fault zones have long been associated with major
hydrocarbon accumulations (e.g., Harding, 1973, 1974, 1976, 1990; Sylvester and
Smith, 1976; Harding et al., 1985; Lowell, 1985; Biddle, 1991; Wright, 1991;
Peters et al., 1994; Stone, 1995). Typical trapping mechanisms appear to be en
echelon anticlines, in places combined with stratigraphic traps (Harding, 1974,
1990), formed at restraining bends or stepovers in the strike-slip fault system.
Detailed 3-D structural analyses of such traps are uncommon except for the
Pijnacker and Quealy fields described previously (Figures
20, 23). Other hydrocarbon
accumulations that may occur in pop-up structures include those along the
Newport-Inglewood fault trend, Los Angeles basin (Harding, 1973; Wright, 1991);
the Whittier oil field, Los Angeles basin (Harding, 1974); the Wilmington oil
field, Los Angeles basin (Wright, 1991); and the Point Arguello field, Santa
Maria basin, offshore California (Mero, 1991). The structural information
provided for these fields, however, is insufficient to enable accurate
comparisons with the analog ![]() models
models![]() presented in this article.
presented in this article.
In the analog ![]() models
models![]() anticlinal four-way dip closures are generated above
restraining stepovers in the basement fault system. These are characterized
steep reverse faults that bound the pop-ups and by elongate structure contour
patterns (Figure 16b). The axes
of the pop-up anticlines are oblique to the PDZs of the main basement fault
systems (Figure 9c) Trans pop-up
faults are late stage, compartmentalize the anticlines, and may result in
fractured seals in the upper sections of the pop-ups. Three-dimensional
visualization of pop-up fault systems (Figure
16c) illustrates the structural complexities and curvatures of the
oblique-slip reverse faults that bound the pop-ups. Steep fault and stratal dips
will probably not image well, and hence the analog
anticlinal four-way dip closures are generated above
restraining stepovers in the basement fault system. These are characterized
steep reverse faults that bound the pop-ups and by elongate structure contour
patterns (Figure 16b). The axes
of the pop-up anticlines are oblique to the PDZs of the main basement fault
systems (Figure 9c) Trans pop-up
faults are late stage, compartmentalize the anticlines, and may result in
fractured seals in the upper sections of the pop-ups. Three-dimensional
visualization of pop-up fault systems (Figure
16c) illustrates the structural complexities and curvatures of the
oblique-slip reverse faults that bound the pop-ups. Steep fault and stratal dips
will probably not image well, and hence the analog ![]() models
models![]() may provide guidelines
for the structural interpretation of seismic sections across restraining
stepovers in strike-slip fault systems.
may provide guidelines
for the structural interpretation of seismic sections across restraining
stepovers in strike-slip fault systems.
Restraining stepovers are barriers to continued slip along major strike-slip fault systems. With increased displacement, the stepovers tend to be smoothed out by the development of through-going shears that transect the pop-ups and link the PDZs (cf. Figures 4, 6, 8). As a result, early-formed uplifted areas will become dissected, and fragmented pop-ups will be transported along the major strike-slip system. Cross sections through many of the oil fields along the Newport-Inglewood trend of the Los Angeles basin (Wright, 1991) resemble partial pop-up structures as would be expected to form if the analog model structures previously described were dissected and transported along a linked major strike-slip fault system.
Scaled analog modeling has successfully simulated the
development of pop-ups in a relatively weak sedimentary cover above restraining
stepovers in sinistral strike-slip faults in rigid basement. In particular the
![]() models
models![]() illustrate the progressive evolution of the pop-ups together with the
geometries of the growth sequences deposited at the same time as the uplift
developed. Vertical and
illustrate the progressive evolution of the pop-ups together with the
geometries of the growth sequences deposited at the same time as the uplift
developed. Vertical and ![]() horizontal
horizontal![]() sectioning of the completed
sectioning of the completed ![]() models
models![]() allowed
the full 3-D architecture of the pop-up system to be visualized. Lozenge-shaped
pop-ups are characteristic of underlapping stepovers, whereas rhomboidal and
strongly sigmoidal pop-ups are characteristic of neutral and overlapping
stepovers, respectively. In cross section the pop-ups are dominantly asymmetric
with the bounding faults dipping inward into the basement fault systems.
Symmetric pop-up geometries are only found above the central sections of the
basement stepovers. All pop-ups produced in the modeling program were doubly
plunging anticlines that produced four-way dip closures. With increased stepover
angle (neutral to overlapping) and increased displacement on the basement fault
systems, crosscutting faults transect the central sections of the model pop-ups.
allowed
the full 3-D architecture of the pop-up system to be visualized. Lozenge-shaped
pop-ups are characteristic of underlapping stepovers, whereas rhomboidal and
strongly sigmoidal pop-ups are characteristic of neutral and overlapping
stepovers, respectively. In cross section the pop-ups are dominantly asymmetric
with the bounding faults dipping inward into the basement fault systems.
Symmetric pop-up geometries are only found above the central sections of the
basement stepovers. All pop-ups produced in the modeling program were doubly
plunging anticlines that produced four-way dip closures. With increased stepover
angle (neutral to overlapping) and increased displacement on the basement fault
systems, crosscutting faults transect the central sections of the model pop-ups.
Natural examples of pop-ups from various strike-slip terranes show comparable
morphologies and structures to the analog ![]() models
models![]() . Many pop-ups, however, are
eroded, and their full 3-D fault architecture is not discernible. The analog
. Many pop-ups, however, are
eroded, and their full 3-D fault architecture is not discernible. The analog
![]() models
models![]() described in this article may provide guidelines for the interpretation
of seismic sections across restraining stepovers in strike-slip systems.
Additional, well-imaged, 3-D seismic examples of contractional structures at
strike-slip restraining bends and stepovers are needed, however, to fully test
the applicability of these analog
described in this article may provide guidelines for the interpretation
of seismic sections across restraining stepovers in strike-slip systems.
Additional, well-imaged, 3-D seismic examples of contractional structures at
strike-slip restraining bends and stepovers are needed, however, to fully test
the applicability of these analog ![]() models
models![]() to natural strike-slip systems.
to natural strike-slip systems.
Aydin, A.A., and A. Nur, 1985, The types and roles of stepovers in strike-slip tectonics, in K. T. Biddle and N. Christie-Blick, eds., Strike-slip deformation, basin formation, and sedimentation: SEPM Special Publication 37, p. 35-45.
Biddle, K., ed., 1991, Active margin basins: AAPG Memoir 51, 324 p.
Brown, N.H., and R.H. Sibson, 1989, Structural geology of the Ocotillo Badlands antidilational fault jog, southern California, in D.P. Schwartz and R.H. Sibson, eds., Fault segmentation and controls of rupture initiation and termination: U.S. Geological Survey Open File Report 89-315, p. 94-110.
Calassou, S., C. Larroque, and J. Malavieille, 1993, Transfer zones of deformation in thrust wedges: an experimental study: Tectonophysics, v. 221, p. 325-344.
Campagna, D.J., and A. Aydin, 1991, Tertiary uplift and shortening in the Basin and Range: the Echo Hills, southeastern Nevada: Geology, v. 19, p. 485-488.
Christie-Blick, N., and K.T. Biddle, 1985, Deformation and basin formation along strike-slip faults, in K.T. Biddle and N. Christie-Blick, eds., Strike-slip deformation, basin formation, and sedimentation: SEPM Special Publication 37, p. 1-35.
Crowell, J.C., 1974, Origin of late Cenozoic basins in southern California, in R.H. Dott and R. H. Shaver, eds., Modern and ancient geosynclinal sedimentation: SEPM Special Publication 19, p. 292-303.
Cunningham, W.D., B.F. Windley, D. Dorjnamjaa, G. Badamgarov, and M. Saandar, 1996, A structural transect across the Mongolian western Altai: active transpressional mountain building in central Asia: Tectonics, v. 15, p. 142-156.
Dickinson, W.R., 1996, Kinematics of transrotational tectonism in the California Transverse Ranges and its contribution to cumulative slip along the San Andreas transform fault system: Geological Society of America Special Paper 305, 46 p.
Dooley, T., and K.R. McClay, 1997, Analog modelling of strike-slip pull-apart basins: AAPG Bulletin, v. 81, p. 804-826.
Harding, T.P., 1973, Newport-Inglewood trend, California--an example of wrenching style of deformation: AAPG Bulletin, v. 57, p. 97-116.
Harding, T.P., 1974, Petroleum traps associated with wrench faults: AAPG Bulletin, v. 58, p. 1290-1304.
Harding, T.P., 1976, Tectonic significance and hydrocarbon trapping consequences of sequential folding synchronous with San Andreas faulting, San Joaquin Valley, California: AAPG Bulletin, v. 60, p. 356-378.
Harding, T.P., 1990, Identification of wrench faults using subsurface structural data: criteria and pitfalls: AAPG Bulletin, v. 74, p. 1590-1609.
Harding, T.P., R.C. Vierbuchen, and N. Christie-Blick, 1985, Structural styles, plate-tectonic settings, and hydrocarbon traps of divergent (transtensional) wrench faults, in K.T. Biddle and N. Christie-Blick, eds., Strike-slip deformation, basin formation, and sedimentation: SEPM Special Publication 37, p. 51-78.
Horsfield, W.T., 1977, An experimental approach to basement-controlled faulting: Geologae en Mijnbouw, v. 56, p. 363-370.
Horsfield, W.T., 1980, Contemporaneous movement along crossing conjugate normal faults: Journal of Structural Geology, v. 2, p. 305-310.
Jones, D.L., R. Graymer, C. Wang, T.V. McEvilly, and A. Lomax, 1994, Neogene transpressive evolution of the California Coast Ranges: Tectonics, v. 13, p. 561-574.
Keller, J.V.A., S.H. Hall, and K.R. McClay, 1997, Shear fracture pattern and microstructural evolution in transpressional fault zones from field and laboratory studies: Journal of Structural Geology, v. 19, p. 1173-1187.
Lallemand, S., J. Malavieille, and S. Calassou, 1992, Effects of oceanic ridge subduction on accretionary wedges: Tectonics, v 11, p. 1301-1313.
Lowell, J.D., 1985, Structural styles in petroleum exploration: Tulsa, Oil and Gas Consultants International, 460 p.
Malavieille, J., S. Calassou, and C. Larroque, 1993, Modelisation experimentale des relations tectonique sedimentation entre bassin avant-arc et prisme d'accretion: Compte Rendu Acadamie des Sciences, v. 316, p. 1131-1137.
Mandl, G., 1988, Mechanics of tectonic faulting: Netherlands, Elsevier, 407 p.
Mann, P., P.R. Hempton, D.C. Bradley, and K. Burke, 1983, Development of pull-aparts: Journal of Geology, v. 91, p. 529-554.
McClay,
K.R., 1990, Deformation mechanics in analogue ![]() models
models![]() of extensional fault
systems, in E.H. Rutter and R. J. Knipe, eds., Deformation mechanisms,
rheology and tectonics: Geological Society Special Publication 54, p. 445-454.
of extensional fault
systems, in E.H. Rutter and R. J. Knipe, eds., Deformation mechanisms,
rheology and tectonics: Geological Society Special Publication 54, p. 445-454.
McClay, K.R., 1995a, The geometries and kinematics of inverted fault systems: a review of analogue model studies, in J.G. Buchanan and P.G. Buchanan, eds., Inversion tectonics: Geological Society Special Publication 88, p. 97-118.
McClay, K.R., 1995b, 2-D and 3-D analogue modelling of extensional fault structures: templates for seismic interpretation: Petroleum Geoscience, v. 1, p. 163-178.
McClay,
K., and T. Dooley, 1995, Analog ![]() models
models![]() of pull-aparts: Geology, v. 23, p.
711-714.
of pull-aparts: Geology, v. 23, p.
711-714.
McClay, K.R., and M.J. White, 1995, Analogue modelling of orthogonal and oblique rifting: Marine and Petroleum Geology, v. 12, p. 137-151.
McKenzie, D., and J. Jackson, 1986, A block model of distributed deformation by block faulting: Journal of the Geological Society of London, v. 143, p. 349-353.
Mero, W.E., 1991: Point Arguello field--USA Santa Maria Basin, offshore California, in N.H. Foster and E.A. Beaumont, eds., Structural traps V.: AAPG Treatise of Petroleum Geology--Atlas of Oil and Gas Fields, p. 27-57.
Naylor, M.A., G. Mandl, and C.H.K. Sijpesteijn, 1986, Fault geometries in basement-induced wrench faulting under different initial stress states: Journal of Structural Geology, v. 8, p. 737-752.
Paylor II, E.D., and A. Yin, 1993, Left-slip evolution of the North Owl Creek fault system, Wyoming, during Laramide shortening, in C.J. Scmidt, R.B. Chase, and E.A. Erslev, eds., Laramide basement deformation in the Rocky Mountain foreland of the western United States: Geological Society of America Special Paper 280, p. 229-242.
Peters, K.E., T.D. Elam, M.H. Pytte, and P. Sundararaman, 1994, Identification of petroleum systems adjacent to the San Andreas fault, California, USA, in L.B. Magoon and W.G. Dow, eds., The petroleum system--from source to trap: AAPG Memoir 60, p. 423-436.
Powell, R.E., R.J. Weldon, and J.C. Matti, 1993, The San Andreas fault system: displacement, palinspastic reconstruction and geologic evolution: Geological Society of America Memoir 178, 332 p.
Racero-Baema, A., and S.J. Drake, 1996, Structural style and reservoir development in the West Netherlands oil province, in H.E. Rondeel, D.A.J. Batjes, and W.H. Niewenhuis, eds., Geology of gas and oil under the Netherlands: Amsterdam, Kluwer, p. 211-227.
Richard, P.D., 1991. Experiments on faulting in a two layer cover sequence overlying a reactivated basement fault with oblique (normal-wrench or reverse-wrench) slip: Journal of Structural Geology, v. 13, p. 459-469.
Richard, P.D., and P.R. Cobbold, 1990, Experimental insights into partitioning of fault motions in continental convergent wrench zones: Annales Tectonicae, v. 4, p. 35-44.
Richard, P.D., J.F. Ballard, B. Colletta, and P.R. Cobbold, 1989, Fault initiation and development above a basement strike-slip fault: analogue modelling and tomography: Compte Rendu Acadamie des Sciences, v. 309, no. 2, p. 2111-2118.
Richard, P.D., B. Moquet, and P.R. Cobbold, 1991, Experiments on simultaneous faulting and folding above a basement wrench fault: Tectonophysics, v. 188, p. 133-141.
Richard,
P.D., M.A. Naylor, and A. Koopman, 1995, Experimental ![]() models
models![]() of strike-slip
tectonics: Petroleum Geoscience, v. 1, p. 71-80.
of strike-slip
tectonics: Petroleum Geoscience, v. 1, p. 71-80.
Schreurs, G., 1994, Experiments on strike-slip faulting and block rotation: Geology, v. 22, p. 567-570.
Serra, S., and R.A. Nelson, 1989, Clay modelling of rift asymmetry and associated structures: Tectonophysics, v. 153, p. 307-312.
Stone, D.S., 1995, Structure and kinematic genesis of the Quealy wrench duplex: transpressional reactivation of the Precambrian Cheyenne belt in the Laramie basin, Wyoming: AAPG Bulletin, v. 79, p. 1349-1376.
Sylvester, A.G., 1988, Strike-slip faults: Geological Society of America Bulletin, v. 100, p. 1666-1703.
Sylvester, A.G., and R.R. Smith, 1976, Tectonic transpression and basement-controlled deformation in the San Andreas fault zone, Salton trough, California: AAPG Bulletin, v. 60, p. 74-96.
Sylvester, A.G., and R.R. Smith, 1987, Structure section in Painted Canyon, Mecca Hills, southern California, in M.L. Hill, ed., Centennial field guide volume 1: Cordilleran Section Geological Society of America, p. 103-108.
Tron, V., and J-P. Brun, 1991, Experiments on oblique rifting in brittle-ductile systems: Tectonophysics, v. 188, p. 71-84.
Vendeville,
B., 1991, Mechanisms generating normal fault curvature: a review illustrated by
physical ![]() models
models![]() , in A.M. Roberts, G. Yielding, and B. Freeman, eds., The
geometry of normal faults: Geological Society Special Publication 56, p.
241-250.
, in A.M. Roberts, G. Yielding, and B. Freeman, eds., The
geometry of normal faults: Geological Society Special Publication 56, p.
241-250.
Wilcox, R.E., T.P. Harding, and D.R. Seely, 1973, Basin wrench tectonics: AAPG Bulletin, v. 57, p. 74-96.
Withjack, M.O., and W.R. Jamison, 1986, Deformation produced by oblique rifting: Tectonophysics, v. 126, p. 99-124.
Withjack,
M.O., J. Olson, and E. Peterson, 1990, Experimental ![]() models
models![]() of extensional forced
folds: AAPG Bulletin, v. 74, p. 1038-1045.
of extensional forced
folds: AAPG Bulletin, v. 74, p. 1038-1045.
Wright, T.L., 1991, Structural geology and tectonic evolution of the Los Angeles basin, California, in K.T. Biddle, ed., Active margin basins: AAPG Memoir 52, p. 35-130.
Zolnai, G., 1991, Continental wrench-tectonics and hydrocarbon habitat, 2d ed.: AAPG Continuing Education Course Notes 30, unpaginated.
Ken McClay comes from Adelaide, Australia. He has a B.Sc. (honors) degree from Adelaide University and an M.Sc. degree and Ph.D. in structural geology from Imperial College, London. He lectured at Goldsmiths College and is now at Royal Holloway University of London. He has been professor of structural geology since 1991 and is director of the Fault Dynamics Research Group. He was AAPG distinguished lecturer in North America 1994-1995 and AAPG International distinguished lecturer 1998-1999. His research involves extension, thrust, strike-slip, and inversion terranes and their applications to hydrocarbon exploration. He publishes widely, consults, and gives short courses to industry.
Massimo Bonora comes from Ferrara, Italy. He received his degree in geological sciences from Ferrara University and his M.Sc. degree in basin evolution and dynamics from Royal Holloway University of London. Between 1995 and 1998 Massimo worked as a research assistant in the Fault Dynamics Research Group at Royal Holloway. Massimo is now working as a structural geologist within the Latin America team at Midland Valley Ltd. in Glasgow, Scotland.
The research for this article has been supported by the Fault Dynamics Project (sponsored by ARCO British Limited, Petrobras .K. Ltd., BP Exploration, Conoco (U.K.) Limited, Mobil North Sea Limited, and Sun Oil Britain). Ken McClay also gratefully acknowledges funding from ARCO British Limited and BP Exploration. We thank J. Reijs for the data for Figure 21. Critical reviews by A. Sylvester, D. Stone, and J. Sheridan were greatly appreciated. We thank Tim Dooley for many fruitful discussions and assistance with drafting diagrams. Howard Moore constructed the deformation apparatus. Fault Dynamics Publication No. 74.