|
Figure Captions
 Figure
1.
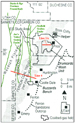
Regional geologic features and index map. Note locations of
seismic lines 2A and 4 and southern end of Schofield graben faulting
crossing line 4. Figure
1.
Regional geologic features and index map. Note locations of
seismic lines 2A and 4 and southern end of Schofield graben faulting
crossing line 4.
 Figure
2.
Diagrammatic regional cross section through study area (modified
from Armstrong, 1968). Figure
2.
Diagrammatic regional cross section through study area (modified
from Armstrong, 1968).
 Figure
3.
Synthetic seismogram and pseudo-velocity log produced from
density log on the Telonis 30-157, Drunkards Wash Field.
Comparison of synthetics created from density
logs and from sonics in the same wells closely match this area. Note the
double trough-peak set generated through the Ferron sand and coal
interval. Figure
3.
Synthetic seismogram and pseudo-velocity log produced from
density log on the Telonis 30-157, Drunkards Wash Field.
Comparison of synthetics created from density
logs and from sonics in the same wells closely match this area. Note the
double trough-peak set generated through the Ferron sand and coal
interval.
 Figure 4a,
b, and c.
Coincident sections demonstrating how stratigraphic changes in
the Ferron interval observed in logs relate to changes seen on seismic. Figure 4a,
b, and c.
Coincident sections demonstrating how stratigraphic changes in
the Ferron interval observed in logs relate to changes seen on seismic.
 Figure
5.
Structure map, top of Lower Ferron
sandstone and water production bubble map. Note location of line 4.
Dip to the WNW away from the San Rafael Swell is
disrupted by a prominent north-south fault near the center of the map,
as seen on accompanying seismic line 4 (Figure
6). Figure
5.
Structure map, top of Lower Ferron
sandstone and water production bubble map. Note location of line 4.
Dip to the WNW away from the San Rafael Swell is
disrupted by a prominent north-south fault near the center of the map,
as seen on accompanying seismic line 4 (Figure
6).
 Figure
6. Buzzard Bench area, seismic line 4, showing prominent faulting of
coal interval with “reverse drag” folding on the downthrown side.
Folding likely increases fracturing and permeability locally near the
fault creating an elongate and linear “fairway” of higher production.
Note that faulting dies out into Jurassic Carmel
evaporitic section. Figure
6. Buzzard Bench area, seismic line 4, showing prominent faulting of
coal interval with “reverse drag” folding on the downthrown side.
Folding likely increases fracturing and permeability locally near the
fault creating an elongate and linear “fairway” of higher production.
Note that faulting dies out into Jurassic Carmel
evaporitic section.
Return
to top.
One of the
most significant domestic CBM plays has been the Ferron trend along the
western flank of the San Rafael Swell, near the town of Price, Utah (Figure
1). In this area, intertonguing coals, sands, and shales were
deposited in a fluvial-deltaic environment on the western side of the
Early Cretaceous Interior seaway (Figure
2).
Development
began on the  play's play's north end, at Drunkards Wash Field in 1992. Since
then, the producing part of the trend has been extended both south and
north and now spans an area about 65 miles long and six to 10 miles
wide. Despite the lateral extent of known Ferron production, large areas
between producing fields remain undeveloped. Limited well control across
these open areas has made characterizing the extent, thickness, quality
and production characteristics of the coals uncertain, and development
has proceeded cautiously. north end, at Drunkards Wash Field in 1992. Since
then, the producing part of the trend has been extended both south and
north and now spans an area about 65 miles long and six to 10 miles
wide. Despite the lateral extent of known Ferron production, large areas
between producing fields remain undeveloped. Limited well control across
these open areas has made characterizing the extent, thickness, quality
and production characteristics of the coals uncertain, and development
has proceeded cautiously.
Coalbed gas
contents also decrease southward in the play and project economics
become progressively leaner. In these areas there is an additional need
to focus development by locating production sweet-spots, or "fairways,"
quickly. Because of these factors, Texaco used seismic to help guide its
most recent development activity in the play.
In two stages
during late 1999, we uniformly reprocessed and interpreted about 140
miles of 1980's vintage 2-D seismic over the Ferron trend. The first
stage was conducted over the Drunkards Wash Field, where dense well
control was used to determine if seismic could identify the causes of
observed production variations. The second stage was intended to expand
what was learned at Drunkards Wash into the southern parts of the trend,
where development is much less complete. Seismic lines from each stage
are presented in this article.
The emphasis
in reprocessing was on attention to detail, particularly for imaging
shallow horizons. Changes observed on seismic had to represent true
changes in the Ferron interval, and even subtle features could not be
ignored since they might prove to be important in understanding the
stratigraphy.
To achieve
reliable results, only lines with similar acquisition parameters were
chosen. Reprocessing efforts included applying refraction statics,
assuring zero-phase data, detailed velocity analyses, correction of CDP
geometry errors, careful selection of shallow mutes, and using improved
deconvolution routines. All steps proved to be very important in
increasing the data's signal to noise ratio, and in optimizing the
quality of shallow reflectors.
The Ferron
interval in the coal-bearing areas is characterized by an upper
sandstone, a middle interval with coal and interbedded siltstones, and a
prominent sandstone at the base known as the Lower Ferron Sandstone.
Synthetic seismograms from this sequence typically show a distinctive
pattern (Figure
3). A weak reflection peak is generated from the upper Ferron
sandstone due to a low impedance contrast with the overlying siltstones
in the Bluegate Shale member. This is followed by a strong trough (or
trough doublet) produced from relatively thick sections of
high-contrast, negative reflection coefficient coals immediately below
the upper sandstone. At the interval base, the tight sandstone of the
lower Ferron once again contrasts sharply with coals, and another high
amplitude peak is produced.
Sonic logs
were available from a few wells close to seismic lines in the Drunkards
Wash area, and synthetic seismograms from these matched the newly
reprocessed seismic quite well. The tool of choice in coal plays is the
density log, however, and nearly all the wells in the field have one of
these. Where wells had both sonic and density logs, pseudosonic curves
created from the density log produced synthetic seismograms that were
nearly identical to those produced from the sonic log.
Drunkards
Wash is fairly densely developed at 160-acre well spacing. Since the
density logs from these wells could be used reliably to generate
synthetics, we were able to tie many nearby wells into the seismic at
closely sampled points along each line. Stratigraphic and lithologic
changes observed in the wells could then be related directly to changes
seen on seismic with high confidence and little interpolation.
Figure 4 shows a series of coincident lines that both demonstrate
our results and show how lithologic and stratigraphic changes seen on
well logs in the Ferron interval translate into changes observed on
seismic:
-
Figure 4a is a Gamma Ray/Density-log stratigraphic cross-section
constructed from wells located on the seismic line.
-
Figure 4b is a seismic model constructed from the synthetics
generated from those wells.
-
Figure 4c is the actual seismic line along the same wells.
The displays
have been hung on a flattened Lower Ferron sandstone and scaled
similarly so they can be compared with ease and accuracy. On the west
(or left) side of
Figure 4, well logs show a thicker Ferron interval. Individual coal
seams occur in groups, forming relatively thick upper and lower
packages. These are resolved as dual high-amplitude troughs (with
maximum negative amplitudes shaded yellow) and are separated by a peak
generated by the intervening siltstones and shales. The last
high-amplitude peak at the interval base is caused by tight Lower Ferron
sandstone.
Moving east
along the line, the coal sections merge and thin, and the intervening
siltstone is lost. Similarly, on the seismic the intervening peak
disappears and coal troughs merge to form a doublet. Amplitudes are
observed to diminish as the section thins, and tuning effects cause
destructive interference in the seismic signal.
On the
eastern end of the line, there is a facies transition to stacked Ferron
shoreline sandstones and the coals are absent by nondeposition. The
seismic interval thins and amplitudes dim further as the coal-sandstone
impedance contrast is lost.
Structural
influences are also recognizable. Disruption of the reflectors due to
faulting is evident on the east-central part of the line (despite
horizon flattening).
Once seismic
stratigraphic and lithologic relationships such as these were
established in areas of better well control, the seismic could be used
to interpret significant changes in the Ferron interval elsewhere.
Similar seismic "facies" observed on other lines were used to map
significant features of the Ferron interval in undeveloped parts of the
play. For example:
-
The thickness of the Ferron interval was mapped and numerical
estimates of stacked coal seam "groups" were made.
-
The approximate lateral limit of coal was plotted. (The coal seams
thin below the resolution of this seismic data set before they pinch
out. However, seam terminations occur fairly rapidly in the area and
the limits could still be estimated with reasonable accuracy).
-
Structure maps were made, and structural features that potentially
influence production were charted.
-
Maps of amplitude were constructed.
Attempts were
also made to correlate observed amplitude changes with variations in
production. Although no simple association was recognized, interval
thickness variation occurring close to the tuning thickness may have
caused amplitude fluctuations that obscured meaningful relationships.
Return
to top.
Structural
Observations, Interpretations
Where
structural features such as faults and folds enhance coal productivity,
seismic can be particularly helpful in focusing play development --
something clearly demonstrated in our geophysical work at Buzzard Bench
field (Figure
1). Initial high water production from CBM wells can be an indicator
of permeability and is often a good sign for future productivity in
newer coalbed methane plays. However, as Texaco began developing the
Buzzard Bench area, many wells there turned out to be low-volume water
producers.
Several wells
on the east side of the field did have dramatically higher water (and
gas) production rates (see
Figure 5). This was encouraging, but on logs, there was no apparent
reason for this enhanced production. The wells were suspiciously aligned
north to south, however, and production changes in one well seemed to
affect the others.
Although this suggested the presence of a fracture or fault system
forming a connected pathway of enhanced permeability, well control alone
could not confirm it. The seismic here aided greatly our understanding
of the geology behind the production anomalies. Seismic line 4 (Figure
6) traverses both the area of poor production to the west (not
shown on the line) and the trend of enhanced production to the east.
Where the line traverses the area of poor production, nothing of
significance in the Ferron interval was observed. As it crosses the area
of better production, however, the line intersects one of the
high-volume water and gas-producing wells, the UP & L 14-55, and clearly
shows a large fault at the Ferron level. It also shows that the well is
in an area of pronounced downward folding (reverse drag-folding) on the
downthrown side of the fault (Figure 6).
Enhanced production in the 14-55 is thus the result of improved
permeability from fracturing along the main fault and from small-scale
antithetic faulting (below seismic resolution) in this zone of reverse
drag folding.
This fault is also found on other lines in the area and can be traced in
a north-south direction where other more-prolific producing wells also
lie along its downthrown side. With the aid of the seismic, we were able
to map a narrow "fairway" of enhanced production parallel to the
downthrown side of the fault and focus further development along this
trend.
Recognition of the fault on seismic also suggested structural causes for
other curious complications in this part of the play; one was continued
high water production from the high permeability wells beyond the
expected volume for normal coal dewatering.
The faulted
and folded zone on Seismic line 4 at Buzzard Bench (Figure
6) resembles a half-graben,
a structure typically associated with extensional tectonics. This zone
and its master fault can be traced from its termination several miles
south of line 4 through the subsurface due north almost to a large fault
of the same strike mapped on the surface geologic map. As it continues
northward, the surface fault gets larger and becomes part of the
Scofield Graben system in the Wasatch Plateau (Figure
1). The connection to that graben system likely explains the half-graben
morphology of the Buzzard Bench fault zone on seismic.
With its exposure on the wetter high plateau, the fault system forms a
conduit for fresh water recharge (seemingly confirmed by maps of
formation water chlorides in this area). This makes dewatering of the
coals along the fault down at Buzzard Bench difficult, and it may take
longer than expected.
Additional
wells would help expedite dewatering of coals in the enhanced
permeability fairway. Therefore, this seismically supported geologic
interpretation provided another reason to target the area for increased
drilling. Although further structural discussion is beyond the scope of
this article, it is important to note that the seismic also helped us
understand the formation of other significant structures observed in the
Ferron trend, such as the Huntington Anticline, and the timing of their
development.
There are
additional benefits conceivable in the Ferron area using seismic. Most
notably, a definitive link between seismic attributes and production
might be possible. Acquisition of new, higher frequency data and perhaps
the use of seismic inversion techniques could achieve this objective.
Shear wave attenuation and Vp/Vs ratios from multi-component seismic
might also be employed to predict areas of increased cleating, related
higher permeabilities, and the associated better production.
In the Ferron
CBM play, seismic was used in a cost-effective way to:
-
Relate coal facies changes observed on well logs to changes seen on
seismic.
-
More completely map the lateral extent of Ferron coals in the play.
-
Guide stratigraphic and structural interpretation in the Ferron CBM
play in areas where well control is lacking.
-
Reveal faults and folds that influence coal permeability and predict "sweetspot"
fairways for targeted development.
-
Develop a much greater understanding of the regional geology of the
play.
Seismic is
not used often in CBM plays, perhaps because of cost concerns or because
of a paradigm that little additional information will be gained from the
effort. We learned from experience in the Ferron CBM play , however, that
seismic adds valuable geologic information which helps to guide
interpretation and focus development. , however, that
seismic adds valuable geologic information which helps to guide
interpretation and focus development.
Reference
Armstrong, R.L., 1968, Sevier
orogenic belt in Nevada and Utah: GSA Bulletin, v. 79, p. 429-258.
Return
to top.
|