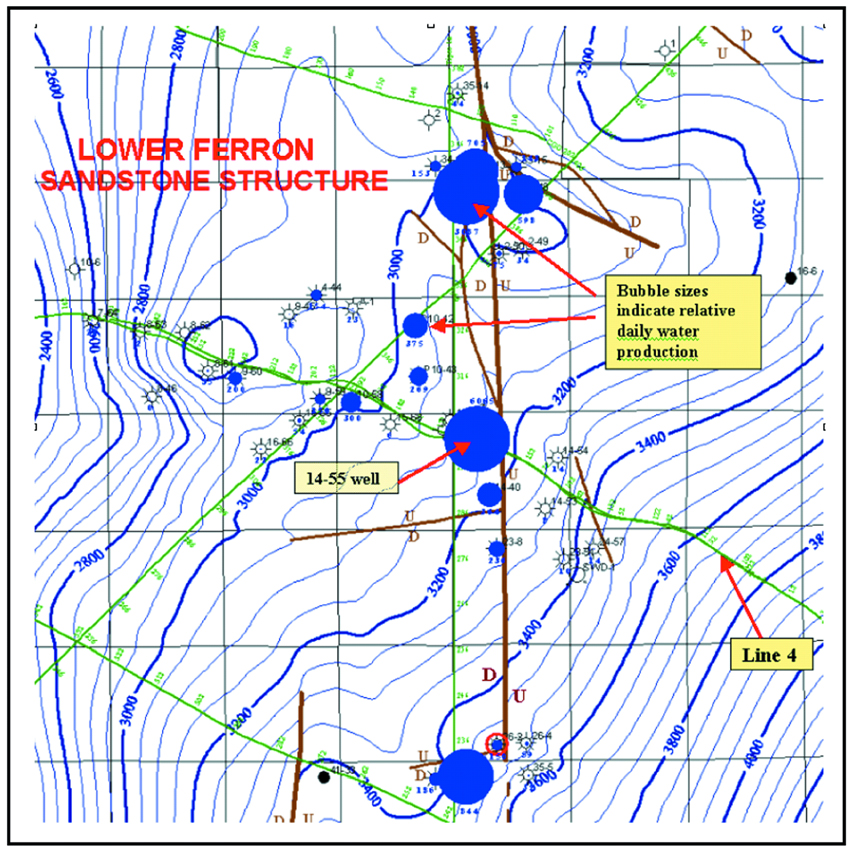
Figure 5. Structure map, top of Lower Ferron sandstone and water production bubble map. Note location of line 4. Dip to the WNW away from the San Rafael Swell is disrupted by a prominent north-south fault near the center of the map, as seen on accompanying seismic line 4 (Figure 6)..