![]() Click to view article in PDF format.
Click to view article in PDF format.
Three-Dimensional Prestack Inversion, Lobo Trend, South Texas*
By
Phil Anno1, Mark Wuenscher1, Robert Corbin1, John Hooper1, and Frank Chlumsky2
Search and Discovery Article #10039 (2003)
*Adapted from “extended abstract” of presentation at AAPG Annual Meeting, March 10-12, 2002, Houston, Texas.
1Conoco Inc., Ponca City, Oklahoma
2Conoco Inc., Houston, Texas
We demonstrate the
difficulty with mapping a Lobo (Paleocene) hydrocarbon reservoir directly from
stacked seismic data. A strong response in the stacked volume is ambiguous,
indicating either a large ![]() impedance
impedance![]() contrast or a contrast in Poisson’s ratio.
contrast or a contrast in Poisson’s ratio.
That is, stacking
of reflection amplitudes over offset (or reflection angle) incorporates
reflections from ![]() impedance
impedance![]() perturbations with those due to a change in Poisson’s
ratio. Dipole sonic log data indicate Poisson’s ratio, but not
perturbations with those due to a change in Poisson’s
ratio. Dipole sonic log data indicate Poisson’s ratio, but not ![]() impedance
impedance![]() ,
distinguishes this particular Lobo reservoir from shale. The hydrocarbon
reservoir
,
distinguishes this particular Lobo reservoir from shale. The hydrocarbon
reservoir ![]() impedance
impedance![]() is similar to that of encasing shales. On the other hand,
Poisson’s ratio decreases over 30% in the reservoir sand.
is similar to that of encasing shales. On the other hand,
Poisson’s ratio decreases over 30% in the reservoir sand.
In this paper, we
invert the prestack amplitudes of a 3-D data volume to distinguish perturbations
in ![]() impedance
impedance![]() from Poisson’s ratio perturbations. We may, therefore, recognize
and map this Lobo reservoir as a decrease in Poisson’s ratio accompanied by
little or no change in
from Poisson’s ratio perturbations. We may, therefore, recognize
and map this Lobo reservoir as a decrease in Poisson’s ratio accompanied by
little or no change in ![]() impedance
impedance![]() .
.
|
|
Click here
to view sequence of Figures 1 and 2 (P-wave
Click here
to view sequence of Figures 3 and 4 (slice--
Click here
to view sequence of Figures 6, 7, and 8 (slice--Poisson’s Ratio,
amplitude, and
The upper Paleocene to Eocene Wilcox Lobo trend is a major low-permeability natural gas producer of the Texas Gulf Coast, already yielding approximately 4.5 TCF of gas. Both structural and stratigraphic complexity can complicate exploration and exploitation of the Lobo trend. Multiple episodes of faulting and erosion can make sand correlation difficult from fault block to fault block. Previous Lobo exploration tools consisted of open-hole logs and dipmeter data combined with 2-D seismic data. These techniques were useful for exploring large slump block features. Over time, the success of these techniques diminished as the size of potential targets decreased. Continuous improvements in 3-D acquisition and processing over the last ten years have positively impacted Lobo exploration and development success. Current 3-D stack volumes resolve much smaller slump blocks. This improved structural definition helps identify acreage that yields superior drilling results. Modern dipole sonic log measurements through the Lobo section point to Poisson’s ratio as a distinguishing reservoir property. Prestack imaging and inversion thus represent a logical next step in the evolution of Lobo exploration and exploitation technology. In this paper we directly image a Lobo reservoir by inverting amplitudes before stack. A signature decrease in Poisson’s ratio tracks the reservoir across faulting.
The well
data of Figures 1 and
2 make the case for prestack, rather than
poststack, inversion in this area of the Lobo trend.
One can
invert throughout the 3-D volume for perturbations in Poisson’s ratio,
along with
Figures 3
and 4 give time slices of the resulting inversion output. These pictures
show, respectively, an image of the perturbations in Though this prestack inversion result is consistent with log data (Figures 1 and 2), it was not constrained by log data. This inversion output derives entirely (seismic wavelet extraction excepted) from prestack amplitude data. We invert amplitudes via an expansion of the form R(q ) =A + Bsin2q + Csin2q tan2q + K (1) Equation (1) expresses reflectivity R as a function of incidence angleq. One derives this equation following the approaches taken by Bortfeld (1961), and Aki and Richards (1980). Shuey (1985) presented a similar approximation. Equation (1) also sets the goal of our entire prestack data processing sequence: preserve this functional relationship between reflections recorded at different angles, while attenuating signals that do not conform to this reflectivity model. This is, of course, “easier said than done”. In the opinion of the first author, this processing goal encompasses most of the expertise required for robust prestack inversion. Parameter
A in equation (1) equates to a perturbation in Parameter
B is the source of information on Poisson’s ratio. It depends in
part on the product of perturbations in both We truncated equation (1) before parameter C for the inversion of Figures 3 and 4. One often neglects this third term for incidence angles less than 25o, the maximum angle preserved through our prestack processing sequence. This term in the expansion is fourth order in q (for smallq ).
Equation
(1) thus makes it clear that stacking of reflection amplitudes over
angle incorporates reflections from
Figures 6,
7 and 8 taken together document this ambiguity for the Lobo section. The
band of prominent reflections in the stack data, just above 1.8 s,
originates mainly from Inversion
before stack attributes this event to low Poisson’s ratio (Figure 6).
This signature gives a direct image of the reservoir, mappable away from
well control and across fault terminations. On the other hand, this Lobo
hydrocarbon reservoir is virtually transparent by way of
Multiple
episodes of faulting and erosion in the Lobo trend can frustrate seismic
correlation and mapping. Moreover, these Lobo reservoirs often produce a
faint expression in the stack volume, especially compared to reflections
from large Dipole
sonic log data reveal the petrophysical key to this problem. These Lobo
reservoirs are reflective at non-zero incidence angles via a decrease in
Poisson’s ratio. We may, therefore, directly image and map the reservoir
by inverting prestack data for perturbations in Poisson’s ratio.
Inversion for
We thank Peter Lellis for hisencouragement and initiative to apply prestack inversion for his business unit. Richard Lunam suggested this data set and directed much of the preprocessing for inversion. Bob Baumel developed much of the inversion software. We also thank Conoco Inc. for permission to publish this paper.
Aki, K., and Richards, P.G., 1980, Quantitative seismology: Theory and methods: W.H. Freeman and Co. Bortfeld, R., 1961, Approximation to the reflection and transmission coefficients of plane longitudinal and transverse waves: Geophys. Prosp., v. 9, 485-503. Shuey, R.T., 1985, A simplification of the Zoeppritz equations: Geophysics, v. 50, p. 609-614.
|
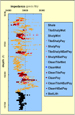 Figure 1.
P-wave
Figure 1.
P-wave 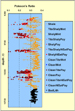 Figure 2.
Poisson’s Ratio well log, coded according to log-derived lithology.
Figure 2.
Poisson’s Ratio well log, coded according to log-derived lithology. Figure 3. A
time slice through the
Figure 3. A
time slice through the 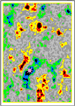 Figure 4. A
time slice through the Poisson’s Ratio perturbation cube from 3-D
prestack inversion.
Figure 4. A
time slice through the Poisson’s Ratio perturbation cube from 3-D
prestack inversion. Figure 6.
An inline slice through the Poisson’s Ratio perturbation cube from 3-D
prestack inversion
Figure 6.
An inline slice through the Poisson’s Ratio perturbation cube from 3-D
prestack inversion Figure 7.
An inline slice through the amplitude stack cube.
Figure 7.
An inline slice through the amplitude stack cube. Figure 8.
An inline slice through the
Figure 8.
An inline slice through the 