Mechanics of
Secondary Hydrocarbon ![]() Migration
Migration![]() and Entrapment
and Entrapment
Tim T. Schowalter 2
Search and Discovery Article #40002 (1999)
- 2 Kirkwood Oil and Gas, Casper, Wyoming 82602.
Table of Contents
- ABSTRACT
 INTRODUCTION
- MECHANICS OF
SECONDARY HYDROCARBON MIGRATION AND ENTRAPMENT
 Driving Forces in Secondary Migration
 - Effects of Hydrodynamics on Driving Forces
- Resistant Forces to Secondary Migration
- Interfacial Tension
- Wettability
- Radius of Pore Throats
- Mercury Capillary Pressure Tests
- Displacement Pressures
- Laboratory Tests of Displacement Pressure
- Test Results
- Capillary Properties of Drill Cuttings
- Conversion of Mercury Data to
Hydrocarbon-Water Data
- Calculations of Hydrocarbon Column
Heights
- Sample Calculation
- Seal Capacity
- Quantitative Hydrocarbon Show
Interpretation
- MIGRATION
AND ENTRAPMENT MODEL
- Differential Entrapment
- Schematic cross-sections related to migration and
entrapment
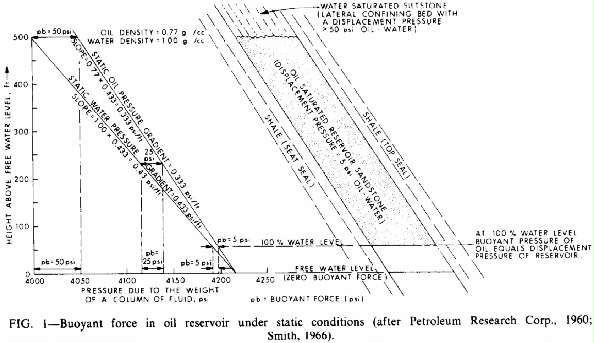
- Buoyant force in
reservoir, static conditions (Fig. 1)
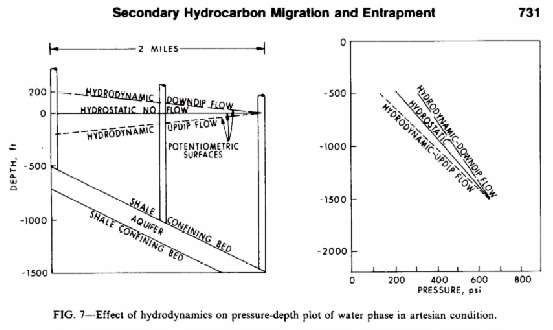
- Effects of
hydrodynamics on pressure-depth plot (Fig. 7)
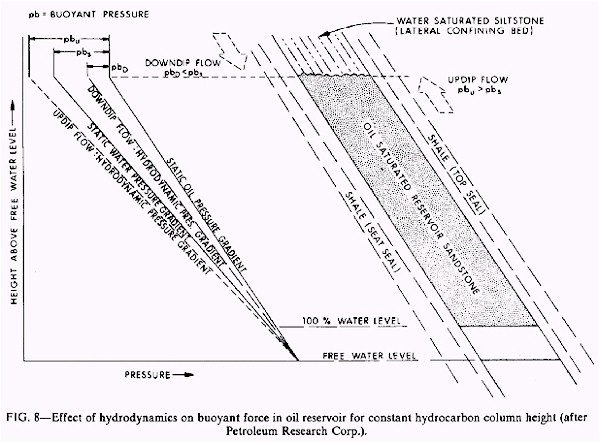
- Effects of
hydrodynamics on buoyant force in oil reservoir (Fig. 8)
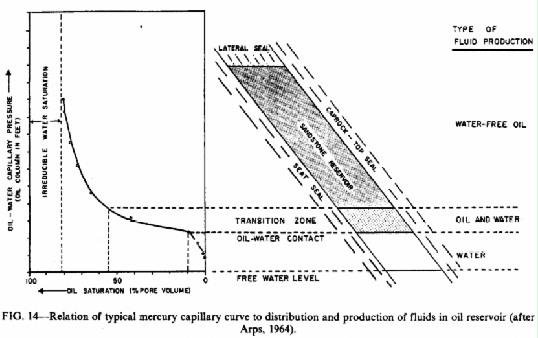
- Distribution of fluids
in reservoir, with capillary curve (Fig. 14)
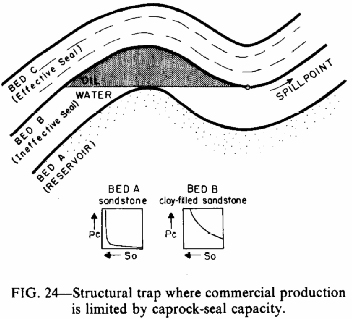
- Seal capacity in
structure (Fig. 24)
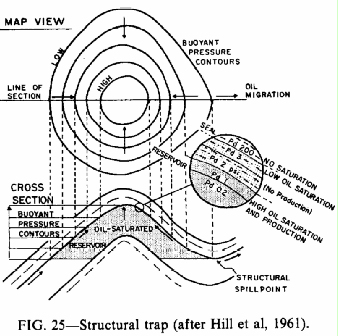
- Buoyant force in
structural trap (Fig. 25)
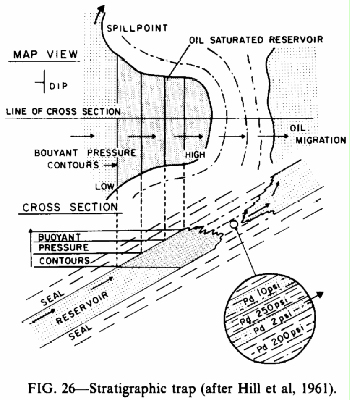
- Buoyant force in
stratigraphic trap (Fig. 26)
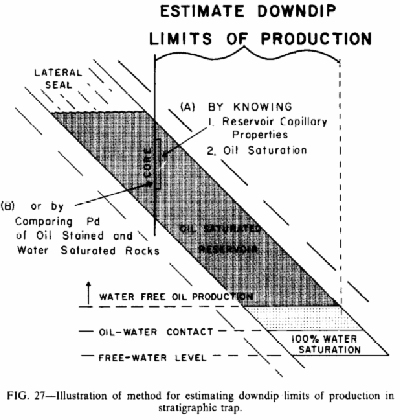
- Downdip limit of
production in stratigraphic trap (Fig. 27)
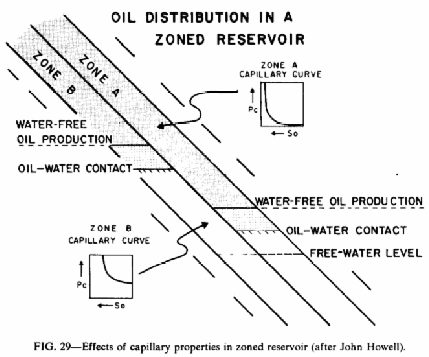
- Capillary properties in
zoned reservoir (Fig. 29)
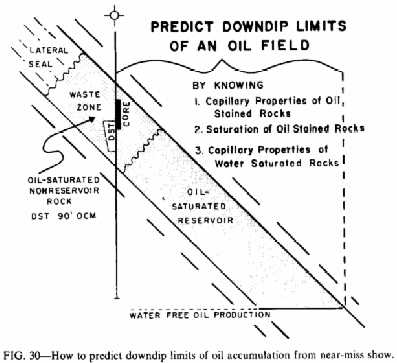
- Downdip limit of oil
accumulation from near-miss show (Fig. 30)
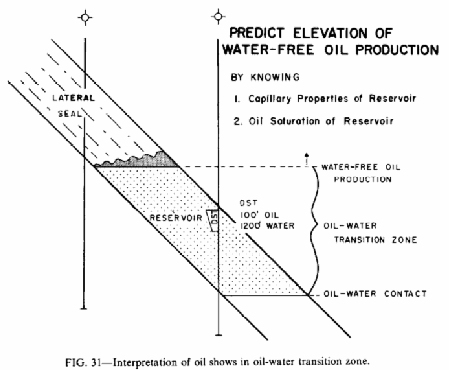
- Shows in oil-water
transition zone (Fig. 31)
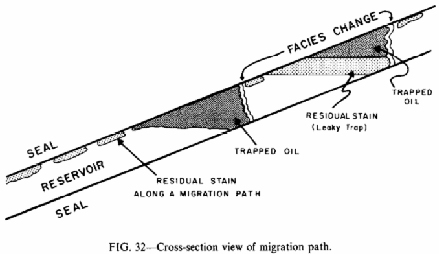
- Migration path (Fig. 32)
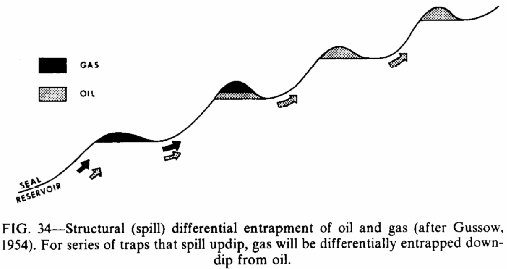
- Structural differential
entrapment (Fig. 34)
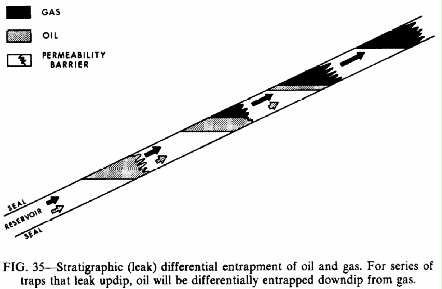
- Stratigraphic
differential entrapment (Fig. 35)
- Capillary-pressure curves related to migration and
entrapment
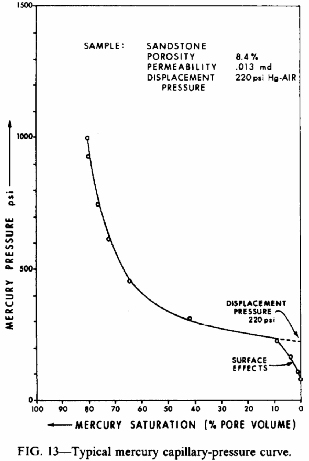
- Mercury (Fig. 13)
- Mercury vs.
distribution of fluids in oil reservoir (Fig. 14)
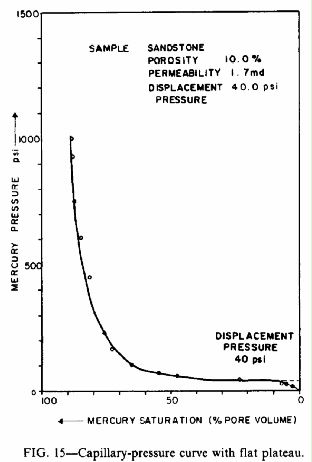
- Curve with plateau (Fig. 15)
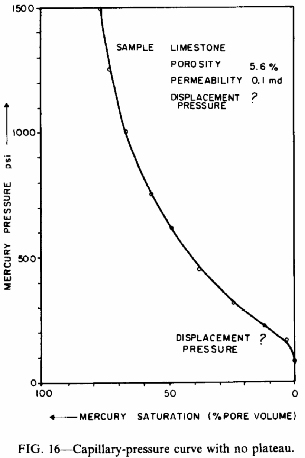
- Curve with no plateau (Fig. 16)
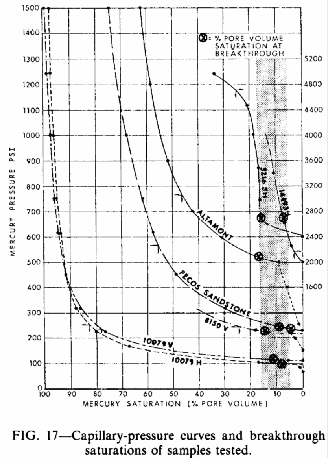
- Breakthrough
saturations (Fig. 17)
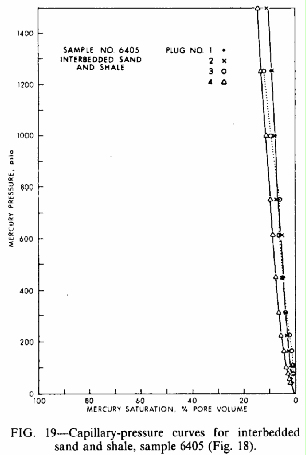
- Interbedded sand and
shale (Fig. 19)
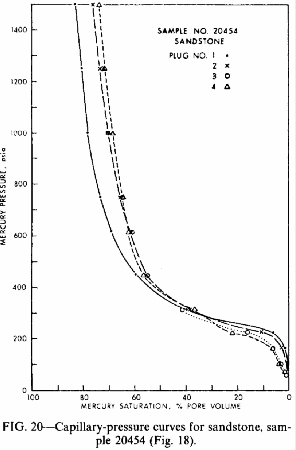
- Sandstone (Fig. 20)
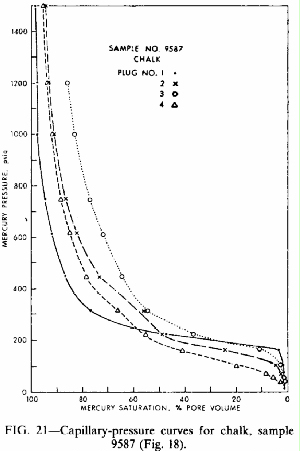
- Chalk (Fig. 21)
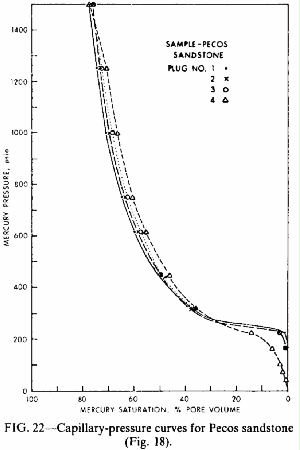
- Pecos sandstone (Fig. 22)
- Sandstone and
clay-filled sandstone (Fig. 24)
- Facies A vs. Facies B (Fig. 25)
- Zoned reservoir (Fig. 26)
- Nomographs related to migration
 and entrapment
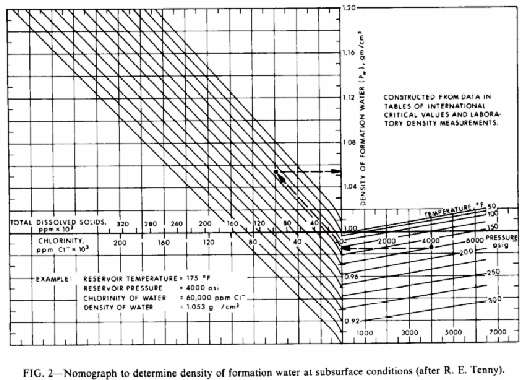
 - Density of formation
water (Fig. 2)
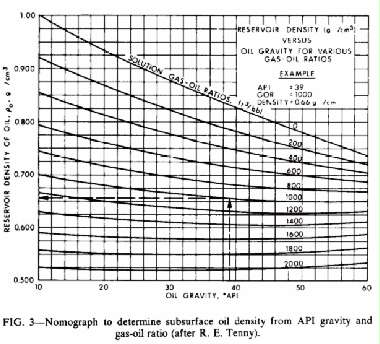
- Oil Density in
subsurface (Fig. 3)
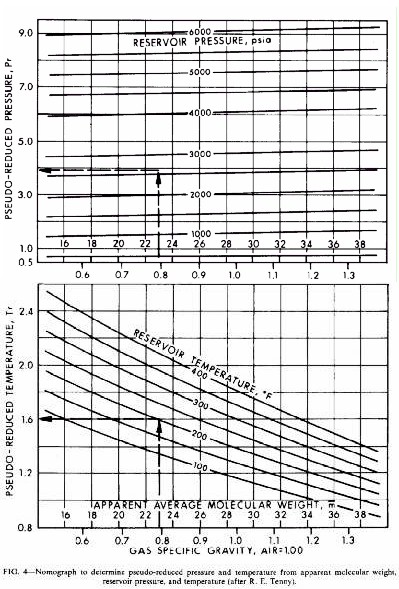
- Pressure/temperature
vs. gas molecular weight (Fig. 4)
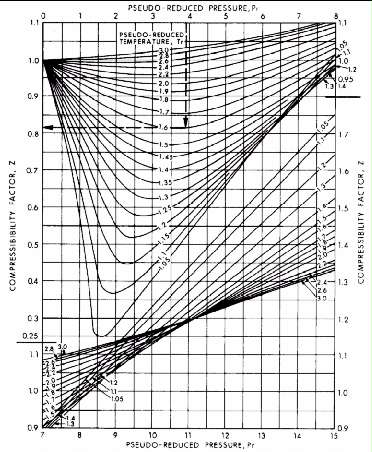
- Compressibility vs.
temperature/pressure (Fig. 5)
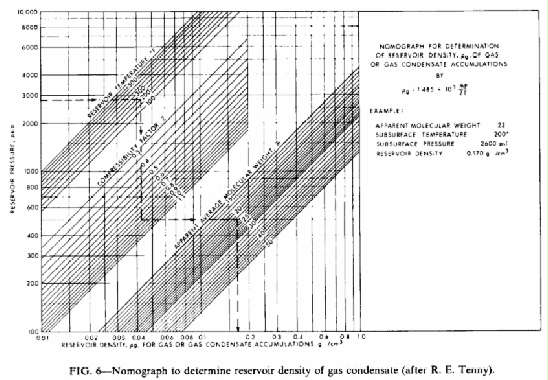
- Reservoir density of
gas condensate (Fig. 6)
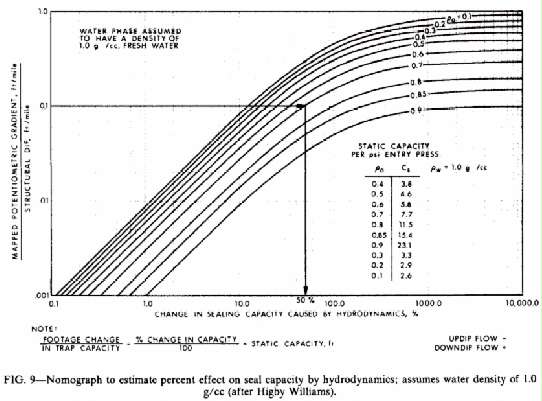
- Seal capacity vs.
hydrodynamics (Fig. 9)
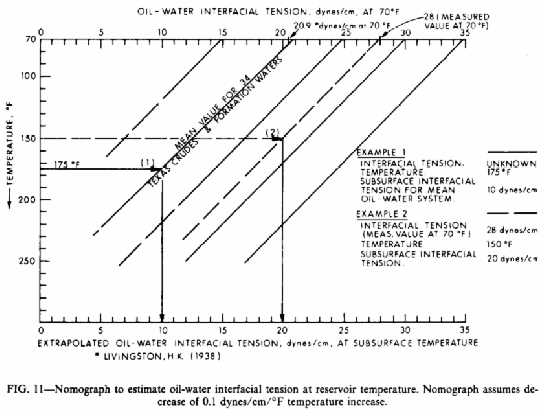
- Oil-water interfacial
tension vs. temperature (Fig. 11)
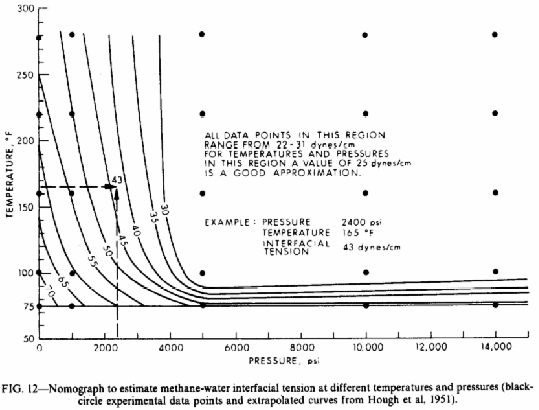
- Methane-water
interfacial tension vs. temperature/pressure (Fig. 12)
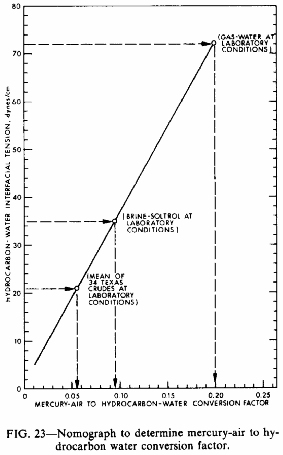
- Mercury-air to
hydrocarbons-water conversion (Fig. 23)
- CONCLUSIONS
- REFERENCES
- Acknowledgments:
- This paper is based on work done at Shell Development Research in Houston during 1972-74. I thank Shell Development Co. for permission to publish this paper. Special thanks are extended to Bob Purcell, Higby Williams, Paul Hess, and Ben Swanson for their help in formulating and carrying out the project, and to my supervisors, Larry Meckel and Garland Spaight, with credit for some of the figures to R. E. Tenny and John Howell.
- Copyright 1994 American Association of Petroleum Geologists