![]()
Mechanics of Secondary Hydrocarbon Migration and Entrapment
by
Tim T. Schowalter
![]()
|
The mechanics of secondary hydrocarbon
migration and entrapment are well-understood physical
processes that can be dealt with quantitatively in
hydrocarbon exploration. The main driving force for
secondary migration of hydrocarbons is buoyancy. If the
densities of the hydrocarbon phase and the water phase
are known, then the magnitude of the buoyant force can be
determined for any hydrocarbon column in the subsurface.
Hydrocarbon and water densities vary significantly.
Subsurface oil densities range from 0.5 to 1.0 g/cc;
subsurface water densities range from 1.0 to 1.2 g/cc.
When a hydrodynamic condition exists in the subsurface,
the buoyant force of any hydrocarbon column will be
different from that in the hydrostatic case. This effect
can be quantified if the potentiometric gradient and dip
of the formation are known. The main resistant force to
secondary hydrocarbon migration is capillary pressure.
The factors determining the magnitude of the resistant
force are the radius of the pore throats of the rock,
hydrocarbon-water interfacial tension, and wettability.
For cylindrical pores, the resistant force can be
quantified by the simple relation: A thorough understanding of these principles can aid both qualitatively and quantitatively in the exploration and development of petroleum reserves. |
![]()
Primary migration is here defined as the movement of hydrocarbons (oil and natural gas) from mature organic-rich source rocks to an escape point where the oil and gas collect as droplets or stringers of continuous-phase liquid hydrocarbon and secondary migration can occur. The escape point from the source rock can be any point where hydrocarbons can begin to migrate as continuous-phase fluid through water-saturated porosity. The escape point then could be anywhere the source rock is adjacent to a reservoir rock, an open fault plane, or an open fracture. Secondary migration is the movement of hydrocarbons as a single continuous-phase fluid through water-saturated rocks, faults, or fractures and the concentration of the fluid in trapped accumulations of oil and gas. Numerous mechanisms for primary migration have been proposed. The main proposed mechanisms for secondary migration are buoyancy and hydrodynamics.
The mechanisms of primary hydrocarbon migration and the timing of hydrocarbon expulsion have been debated by petroleum geologists since the beginning of the science. Mechanisms proposed for primary hydrocarbon migration include: solution in water, diffusion through water, dispersed droplets, soap micelles, continuous-phase migration through the water-saturated pores, and others. Early workers generally favored early expulsion of hydrocarbons with the water phase of compacting sediments. Recent geochemical evidence, as summarized by Cordell (1972), suggests that oil is formed at depths where the petroleum source rocks have lost most of their pore fluids by compaction. On the basis of these conclusions, Dickey (1975) suggested a case for primary migration of oil as a continuous-phase globule through the pores of the source rock. This concept was documented in part by Roof and Rutherford (1958) who suggested that continuous-phase oil migration from source rock to reservoir is required to explain the chemistry of known oil accumulations. Gas accumulations, however, can be explained by either continuous-phase primary migration or by discontinuous molecular-scale movement of gas dissolved in water (Roof and Rutherford, 1958). Price (1976) offered still another expulsion concept. He postulated molecular solution at high temperature, upward movement with compaction fluids, and exsolution at shallower depths in low-temperature saline waters.
Regardless of the correct answer or combination of answers to the question of time and mechanism of primary hydrocarbon migration, secondary migration through reservoir carrier beds is the necessary next step for the formation of a commercial oil or gas accumulation. A thorough understanding of the mechanics of secondary hydrocarbon migration and entrapment is useful in the exploration for oil and gas. Knowledge in this area of exploration can be critical in tracing hydrocarbon migration routes, interpreting hydrocarbon shows, predicting vertical and lateral seal capacity, exploiting discovered fields, and in the general understanding of the distribution of hydrocarbons in the subsurface. The importance of understanding the mechanics of secondary migration and entrapment, particularly in the exploration for subtle stratigraphic traps, is illustrated by McNeal (1961), Harms (1966), Smith (1966), Stone and Hoeger (1973), Berg (1975), and by numerous papers by the Petroleum Research Corp. These articles provide an excellent starting point for a sound understanding of the principles involved. However, none of these papers adequately discuss the range of variables involved in secondary migration and how to cope with them. Nor do they discuss fully the quantitative and qualitative exploration implication of these principles. A thorough review of these principles is presented here with input of new research where appropriate.
![]()
MECHANICS OF SECONDARY HYDROCARBON MIGRATION AND ENTRAPMENT
If an oil droplet were expelled from a source rock whose boundary was the seafloor, oil would rise through seawater as a continuous-phase droplet because oil is less dense than water and the two fluids are immiscible. The rate of rise would depend on the density difference (buoyancy) between the oil and the water phase. The main driving force then for the upward movement of oil through sea water is buoyancy. Buoyancy is also the main driving force for oil or gas migrating through water-saturated rocks in the subsurface. In the subsurface, where oil must migrate through the pores of rock, there exists a resistant force to the migration of hydrocarbons that was not present in the simple example. The factors that determine the magnitude of this resistant force are (1) the radius of the pore throats of the rock, and (2) the hydrocarbon-water interfacial tension, and (3) wettability. These factors, in combination, are generally called "capillary pressure." Capillary pressure has been defined as the pressure difference between the oil phase and the water phase across a curved oil-water interface (Leverett, 1941). Berg (1975) pointed out that capillary pressure between oil and water in rock pores is responsible for trapping oil and gas in the subsurface. A more thorough discussion of capillary pressure than is presented here is contained in Berg's paper.
To begin our discussion of the mechanics of secondary migration and entrapment and the variables involved, we look at an oil accumulation in a reservoir under static conditions.
Driving Forces in Secondary Migration
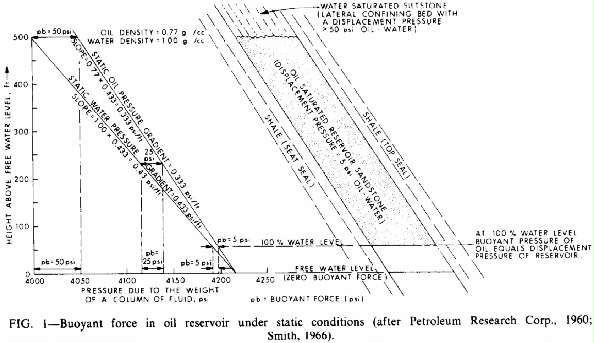
Under hydrostatic conditions, buoyancy is the main driving force for continuous-phase secondary hydrocarbon migration. When two immiscible fluids (hydrocarbon and water) occur in a rock, a buoyant force is created owing to the density difference between the hydrocarbon phase and the water phase. The greater the density difference, the greater the buoyant force for a given length hydrocarbon column (always measured vertically). For a static continuous hydrocarbon column, the buoyant force increases vertically upward through the column. Figure 1 illustrates the buoyant force for a stratigraphically trapped static oil column in a porous reservoir sandstone. As illustrated on the right of the figure, the reservoir sandstone is confined vertically by a caprock shale seal and seat seal, the oil is trapped laterally by siltstone, and an oil-water contact is present downdip in the homogeneous reservoir sandstone. On the left of the figure the pressure due to the weight of the column of oil (density 0.77 g/cc) and the pressure due to an equal column of water (density 1.00 g/cc) are plotted on the horizontal axis; the vertical axis is the height in feet above the free water level. The free water level is the level at which water would stand in a large open hole. In terms of buoyancy this can also be defined as the point of zero buoyant force. The 100% water level is the vertical position above which the reservoir rock has a water saturation less than 100%.
When the pressure of a static fluid is plotted against depth, each fluid will have a particular slope depending on the density of the fluid. The slope or static fluid pressure gradient in psi/ft for any fluid can be calculated by multiplying the density in g/cc by 0.433.
For the example in Figure 1, the static fluid pressure gradient for the water phase would be 0.433 (4.33 x 0.1); the static fluid pressure gradient for the oil phase would be 0.333 (0.433 x 0.77).
The pressure decrease with height above the free water level or the static fluid pressure gradient (as plotted on the left side of Figure 1) is greater in the denser water phase (0.433 psi/ft) than in the oil phase (0.333 psi/ft). The difference in pressure between the water phase and the oil phase at any point above the free water level is the buoyant force at that point. The buoyancy gradient, or the rate of buoyant pressure increase with height above the free water level, can be calculated by subtracting the oil pressure gradient (0.333 psi/ft) from the water pressure gradient (0.433 psi/ft). For the oil and water in Figure 1, the buoyancy gradient then is 0.1 psi/ft. With these conditions, a 100-ft oil column would produce a driving force of 10 psi at the top of the column and a 500-ft oil column would have a buoyant force of 50 psi as illustrated in Figure 1.
An analogy for the upward buoyant or driving force of a static oil column is the upward force generated by a wooden two-by-four vertically trapped in a tank of water. The longer the two-by-four, the greater the buoyant force at the top of the board. In Figure 1, if the length of the vertical column of oil were increased, the buoyant force at the top of the oil column would be increased. Also, in our two-by-four example, the lower the density of the two-by-four, the greater the buoyant force for a given length of board. If the density of the oil were decreased or if the density of the water were increased for a given length hydrocarbon column, the buoyant force would be greater than the 50-psi illustration in Figure 1 for a 500-ft oil column.
Subsurface densities of hydrocarbon and water phases are important, then, in determining buoyant driving forces in secondary migration and entrapment of hydrocarbons. Subsurface water densities generally range from 1.0 to 1.2 g/cc, resulting in static water pressure gradients of 0.433 to 0.52 psi/ft. Subsurface oil densities vary from approximately 0.5 to 1.0 psi/ft, resulting in static oil pressure gradients of 0.22 to 0.43. Oil-water buoyancy gradients for the subsurface oil and water densities usually encountered are generally on the order of 0.1 psi/ft. However, the range of the oil and water densities that are encountered in the subsurface suggests that there are vast differences in the ability of oil in different oil-water systems to migrate through a given reservoir rock or to be trapped by a given seal.
Figure 1. Buoyant force in oil reservoir under static conditions (after Petroleum Research Corp., 1960; Smith, 1966).
Gas densities range from as low as 0.00073 g/cc for methane at atmospheric pressure to approximately 0.5 g/cc for typical natural gas mixtures at high pressures (5,000 to 10,000 psi). Static pressure gradients for naturally occurring gas in the subsurface range from less than 0.001 to more than 0.22 psi/ft. The buoyancy gradient for gas-water systems in the subsurface can range from approximately 0.2 psi/ft to 0.5 psi/ft. The migration and entrapment of natural gas in a continuous phase in the subsurface then would vary greatly depending on the gas-water system in question. Gas-water systems generally have higher driving force than oil-water systems.
To quantify the buoyant force for a given hydrocarbon-water system the density of the water phase and of the hydrocarbon phase must be determined. To be useful in exploration these values must be obtainable from information generally available to the petroleum explorationist.
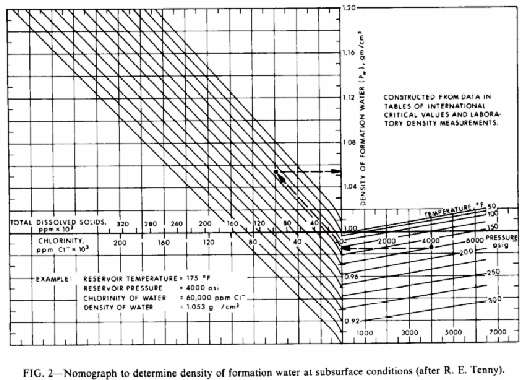
The three main variables affecting subsurface water density are: pressure, temperature, and the amount and kinds of dissolved solids. Figure 2 provides a means of estimating subsurface water densities considering the mentioned variables. In situations where the dominant negative ion is chloride, the chloride-ion concentration scale can be used. For waters that contain appreciable amounts of negative ions other than chloride, the upper scale for total dissolved solids should be used. The chlorinity or the total dissolved solids are generally available in exploration settings as are appropriate temperature and pressure information. Direct measurement of water densities can also be used but should be converted to subsurface temperature and pressure.
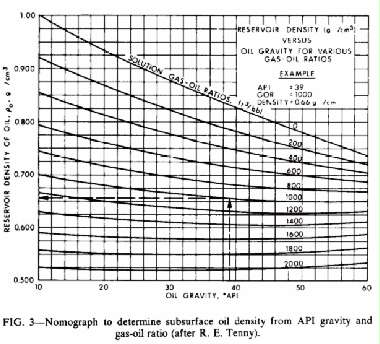
The density of oil in the subsurface is dependent on composition of the oil and dissolved gases, temperature, and pressure. Oil or condensate subsurface density can be estimated with workable accuracy if the stock tank API gravity and the solution gas-oil ratio in standard cubic feet/stock tank barrel (SCF/STB) are known (Figure 3). Direct measurements of oil and its associated gas recombined at subsurface temperature and pressure are sometimes made by petroleum engineers. When these pressure-volume-temperature (PVT) values are available, they provide the most reliable estimates of subsurface oil densities.
Figure 2. Nomograph to determine density of formation water at subsurface conditions (after R. E. Tenny).
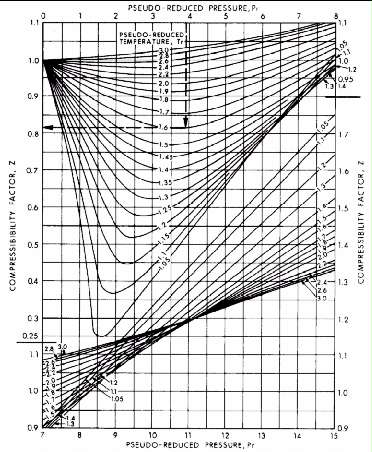
The density of a gas in the subsurface is a function of the ratio of its mass to volume. The mass of a given amount of gas is related to the apparent molecular weight of the gas. The volume occupied by the gas is related to the pressure, temperature, and the apparent average molecular weight. The deviation in the behavior of a gas mixture from that postulated by the ideal gas law is related to the gas and subsurface conditions through a compressibility factor Z.
The equation used to determine the density of a gas in the subsurface is:
![]()
where ![]() =
subsurface density of gas (g/cc); m = apparent average molecular
weight; p = absolute subsurface pressure (lb/sq in.); Z =
compressibility factor; and T = absolute subsurface temperature
(Rankine).
=
subsurface density of gas (g/cc); m = apparent average molecular
weight; p = absolute subsurface pressure (lb/sq in.); Z =
compressibility factor; and T = absolute subsurface temperature
(Rankine).
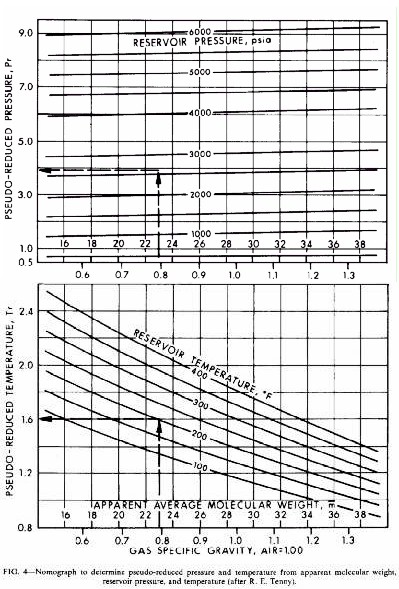
If the apparent molecular weight (which can be estimated from
gas composition), subsurface temperature, and pressure are known,
the gas density can be estimated by using Figure 4, Figure 5, and Figure 6. The following procedure
can be used to determine ![]() : (1) determine the apparent molecular
weight of the gas mixture by calculating the percentage and
molecular weight of each component in the gas mixture (e.g., the
molecular weight for methane, CH4, is 16, as carbon has a molecular weight of 12 and
hydrogen a molecular weight of 1); (2) read the pseudo-reduced
temperature and pressure from Figure
4; (3) determine a compressibility factor, Z, from Figure 5; (4) determine subsurface
gas density by use of Figure 6.
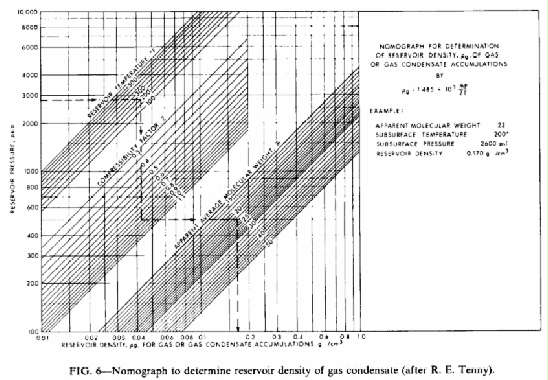
An example is shown on each figure using a gas with an apparent
molecular weight of 23, a subsurface temperature of 200°F, and
pressure of 2,600 psi.
: (1) determine the apparent molecular
weight of the gas mixture by calculating the percentage and
molecular weight of each component in the gas mixture (e.g., the
molecular weight for methane, CH4, is 16, as carbon has a molecular weight of 12 and
hydrogen a molecular weight of 1); (2) read the pseudo-reduced
temperature and pressure from Figure
4; (3) determine a compressibility factor, Z, from Figure 5; (4) determine subsurface
gas density by use of Figure 6.
An example is shown on each figure using a gas with an apparent
molecular weight of 23, a subsurface temperature of 200°F, and
pressure of 2,600 psi.
Effects of Hydrodynamics on Driving Forces
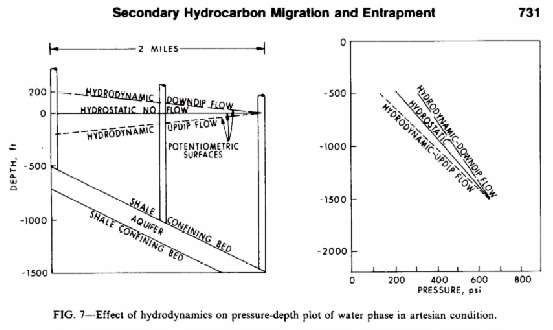
The importance of hydrodynamics with regard to oil entrapment in structural traps has been discussed in detail by Hubbert (1953). Numerous other authors have since documented the effects of hydrodynamics on structural oil reservoirs throughout the world. In thinking of the effects of hydrodynamics on secondary migration and primarily stratigraphic-type entrapment of hydrocarbons, we must consider how a hydrodynamic condition would effect the buoyant driving force of a hydrocarbon filament in the subsurface. Hydrodynamic conditions in the subsurface change the buoyant force, and therefore the migration potential, for a hydrocarbon column of a given height. Buoyancy, as has been defined for a static oil filament, is the pressure in the water phase minus the pressure in the oil phase at a given height above the free water level. When a hydrodynamic condition exists, the pressure in the water phase (and therefore the buoyant force) at any point will be different from that for hydrostatic conditions. Figure 7 (left side) illustrates the pressure difference in the water phase of an aquifer for an artesian gravity-type hydrodynamic condition for both updip and downdip flow. A hydrodynamic condition will also affect the water pressure-depth plot for a reservoir (Figure 7, right side). Relative to hydrostatic conditions, downdip flow increases the slope of the pressure-depth plot; conversely, updip flow decreases the slope (Figure 7, right side).
Figure 3. Nomograph to determine subsurface oil density from API gravity and gas-oil ratio (after R. E. Tenny).
Figure 4. Nomograph to determine pseudo-reduced pressure and temperature from apparent molecular weight, reservoir pressure, and temperature (after R. E. Tenny).
Figure 5. Nomograph to determine compressibility factor, z, at pseudo-reduced temperature and pressure (after R. E. Tenny).
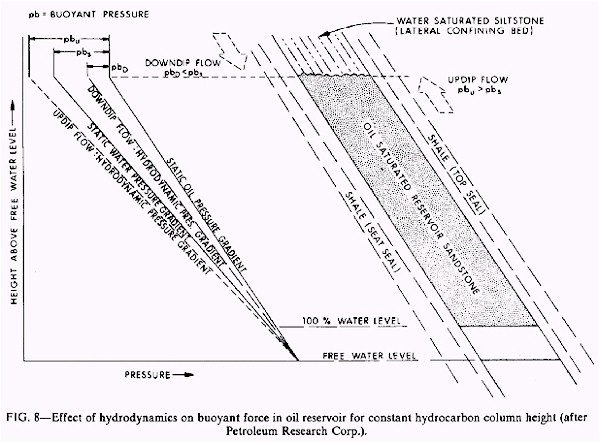
The pressure-depth plot (Figure 1) was used to study the buoyant pressure for a given hydrocarbon column under hydrostatic conditions. In Figure 7 and Figure 8, this same type of graph is used to show how the buoyant pressure of a given oil column will be different for hydrodynamic conditions. With upward water flow through a reservoir, the pressure difference between the water phase and the oil phase at the top of a given trapped oil column will be greater than the pressure difference for the same height oil column in the hydrostatic case (Figure 8). When downward water flow occurs in a reservoir, the pressure difference between the water phase and the oil phase at the top of a given oil column is less than the hydrostatic case (Figure 8) for the same height oil column.
From Figure 8 we can see that downdip flow reduces buoyancy or migration potential, and updip flow increases buoyancy or migration potential for any given oil filament in the subsurface. Transferring this observation to lateral seal capacity in the stratigraphic entrapment of hydrocarbons, downdip flow increases the seal capacity of a given lateral confining bed along a migration path by reducing the buoyant pressure of any hydrocarbon filament through a reservoir. Updip flow would effectively reduce lateral seal capacity in a given zone because the buoyant force for a given hydrocarbon filament would be increased from the hydrostatic. In the exploration for subtle stratigraphic traps, we can readily see the importance of hydrodynamics on the entrapment of hydrocarbons. The positive effect of a downdip hydrodynamic condition in increasing lateral seal capacity and trapping commercial volumes of hydrocarbons has been documented by several authors. This downdip flow or energy potential can be the result of either gravity-type (artesian or confined) hydrodynamic flow or geopressure-type (dewatering) hydrodynamic flow. Case histories of gravity-type (artesian) downdip flow affecting stratigraphic entrapment were discussed by Berry (1958). Hill et al (1961), McNeal (1961, 1965), and Stone and Hoeger (1973). The effects of geopressure (dewatering) hydrodynamic conditions were discussed by Meyers (1968) with examples from the Gulf Coast of the United States where hydrostatically pressured blocks are faulted down against geopressured fault blocks, creating fault traps.
Figure 6. Nomograph to determine reservoir density of gas condensate (after R. E. Tenny).
Figure 7. Effect of hydrodynamics on pressure-depth plot of water phase in artesian condition.
Figure 8. Effect of hydrodynamics on buoyant force in oil reservoir for constant hydrocarbon column height (after Petroleum Research Corp.).
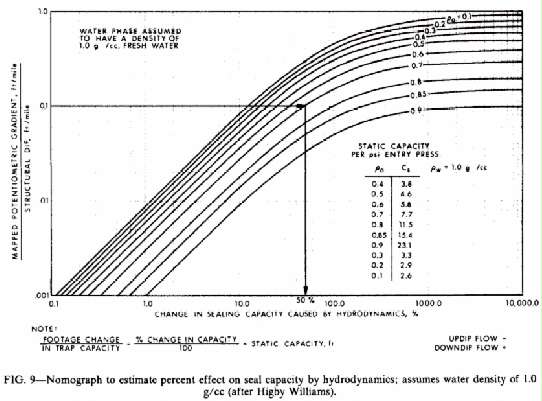
It is clear that attempts to assess secondary hydrocarbon migration and entrapment in a given area must incorporate the effects of hydrodynamics. Berg (1975) derived a formula for determining the effect of updip or downdip flow on buoyancy and/or seal capacity. A nomograph (Figure 9) has been prepared to provide a quick method of quantitatively assessing the effects of hydrodynamics on buoyancy or seal capacity. The data required for this estimate are the mapped potentiometric gradient (ft/mi) of the reservoir in question, the dip of the reservoir bed (ft/mi) and the density of the hydrocarbon phase. The density of the water phase is assumed to be 1.0 g/cc for simplification.
To read the nomograph, divide the mapped potentiometric gradient (ft/mi) by the dip of the reservoir (ft/mi). Enter the nomograph for that value and read across to the known hydrocarbon density, then down to the percent effect on trap capacity or buoyancy. For example, a structural dip of 500 ft/mi, potentiometric gradient of 50 ft/mi, and an oil density of 0.7 g/cc would have a 50% effect on buoyancy or lateral seal capacity. For these conditions, if the flow was in the downdip direction, the buoyant force of any oil filament would be reduced by 50%. The effect on lateral seal capacity for any facies change along the reservoir would conversely be increased by 50%. Updip flow would reduce seal capacity by 50%, as the buoyant force of any oil column would be increased by 50%.
Figure 9. Nomograph to estimate percent effect on seal capacity by hydrodynamics; assumes water density of 1.0 g/cc (after Higby Williams).
Attempts to quantify hydrodynamic effects on stratigraphic entrapment by the use of this nomograph or Berg's formula must be made with caution. First, the construction of potentiometric maps is not always accurate because of lack of usable pressure data, structural and stratigraphic complications, etc. Second, the approach in this paper and in Berg's avoids the effects of the flow of water around an existing oil accumulation due to low relative permeability to water within the oil-saturated reservoir and the change of the potentiometric slope across permeability facies changes within a reservoir. Another factor to consider in exploration applications is that the positive effect of increased lateral seal capacity in a particular rock unit will not trap a larger volume of oil than for the hydrostatic case unless secondary migration continues after initiation of the hydrodynamic condition. Also, the initiation of updip water flow will not necessarily cause the updip lateral seal of an existing stratigraphically trapped hydrocarbon column to leak if the size of the accumulation is already limited by spill around the flanks of the stratigraphic trap and therefore not at critical seal capacity.
Resistant Forces to Secondary Migration
In a previous example we discussed how a filament of oil released at the seafloor would rise through seawater because of the force of buoyancy. If the same filament of oil or gas is required to move through a water-saturated porous rock we have introduced a resistant force to hydrocarbon movement. For the hydrocarbon filament or globule to move through a rock, work is required to squeeze the hydrocarbon filament through the pores of the rock. In more technical terms, the surface area of the hydrocarbon filament must be increased to the point that it will pass through the previously water-saturated pore throats of the rock. The magnitude of this resistant force in any hydrocarbon-water-rock system then is determined by the radius of the pore throats of the rock; the hydrocarbon-water interfacial tension (surface energy); and wettability as expressed by the contact angle of hydrocarbon and water against the solid pore walls as measured through the water phase. This resistant force to migration is generally termed "capillary pressure."
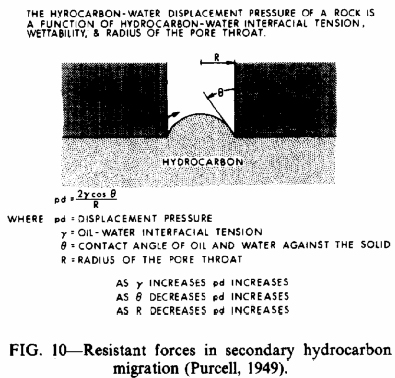
For a simplified example, visualize a hydrocarbon filament trying to move upward through a water-saturated cylindrical pore (Figure 10). The variables of the resistant force to hydrocarbon movement can be expressed by a simple equation (Purcell, 1949):
![]()
where Pd = hydrocarbon-water displacement pressure (dynes/cm2); ![]() =
interfacial tension (dynes/cm);
=
interfacial tension (dynes/cm); ![]() = wettability, expressed by the contact angle of hydrocarbon and
water against the solid (degrees); and R = radius of largest
connected pore throats (cm). The displacement pressure is that
force required to displace water from the cylindrical pore and
force the oil filament through the pore. This resistant force to
migration is analogous to injection pressure as defined by Berg
(1975, p. 941).
= wettability, expressed by the contact angle of hydrocarbon and
water against the solid (degrees); and R = radius of largest
connected pore throats (cm). The displacement pressure is that
force required to displace water from the cylindrical pore and
force the oil filament through the pore. This resistant force to
migration is analogous to injection pressure as defined by Berg
(1975, p. 941).
A change in any of the three variables in this formula will change the displacement pressure or resistant force to secondary migration (Figure 10). The smaller the radius of the cylinder, the greater the displacement pressure. The greater the hydrocarbon-water interfacial tension, the greater the displacement pressure. The smaller the contact angle of hydrocarbon and water against the cylinder wall, the greater the displacement pressure. For water-saturated porous rocks rather than cylindrical pores, Smith (1966) defined the displacement or breakthrough pressure as the minimum pressure required to establish a connected hydrocarbon filament through the largest interconnected water-saturated pore throats of the rock. When a continuous hydrocarbon filament has been established through the pores of the rock, secondary hydrocarbon migration can occur. If the displacement pressure for any hydrocarbon-water-rock system can be determined, the vertical hydrocarbon column necessary to migrate hydrocarbons through this rock can be calculated. The displacement pressure for any hydrocarbon-water-rock system then could be of importance in subsurface petroleum exploration, as the magnitude of this value would determine the sealing capacity for a caprock seal, the trapping capacity for a lateral facies change or fault, or the minimum vertical hydrocarbon column needed to explain an oil show in a given rock.
Figure 10. Resistant forces in secondary hydrocarbon migration (Purcell, 1949).
In determining the displacement or breakthrough pressure for a given hydrocarbon-water-rock system in the subsurface, the hydrocarbon-water-rock system in the subsurface, the hydrocarbon-water-interfacial tension, wettability, and radius of the largest connected pore throats must be measured or estimated. The range of these variables and methods of estimating subsurface values for these variables will be discussed.
Interfacial tension can be defined as the work required to enlarge by unit area the interface between two immiscible fluids (e.g., oil and water). Interfacial tension is the result of the difference between the mutual attraction of like molecules within each fluid and the attraction of dissimilar molecules across the interface of the fluids.
Oil-water interfacial tension varies as a function of the chemical composition of the oil, amount and type of surface-active agents, types and quantities of gas in solution, pH of the water, temperature, and pressure. At atmospheric pressure and 70°F, interfacial tension of crude oils and associated formation water for 34 Texas oil reservoirs of different ages ranged from 13.6 to 34.3 dynes/cm, with a mean of 21 dynes/cm (Livingston, 1938). Oil-water interfacial tension generally tends to decrease with increasing API gravity and decreasing viscosity (Livingston, 1938).
With increasing temperature, oil-water interfacial tension generally decreases. For pure benzene-water and decane-water systems, interfacial tension decreases between 0.03 to 0.08 dynes/cm/°F (Michaels and Hauser, 1950) depending on the pressure. McCaffery (1972) found a decrease of interfacial tension of 0.03 dynes/cm/°F for a pure dodecane-water-system and 0.09 dynes/cm/°F for a pure octane and water system between 100 and 250°F. Natural crude oil and formation water interfacial tension decreases between 0.1 and 0.2 dynes/cm/°F according to Livingston (1938). Hocott (1938) documented a decrease in interfacial tension of approximately 0.1 to 0.15 dynes/cm/°F for natural crude oils between temperatures of 130 and 170°F. The preceding research documents the effect of increasing temperature on oil-water interfacial tension. The effect is complex, but the general trend is for oil-water interfacial tension to decrease as temperature increases. Extrapolation of the results for pure systems and crude oil and for formation water suggests that, for exploration purposes, an oil-water interfacial tension decrease of approximately 0.1 dynes/cm/°F appears to be a reasonable assumption.
The effect of increasing pressure on oil-water interfacial tension is also complex. For pure benzene and water, interfacial tension decreases approximately 0.3 dyne/cm per 100 psi pressure change; for decane and water interfacial tension increases with increasing pressure (Michaels and Hauser, 1950). Dodecane-water and octane-water interfacial tensions also increase slightly with increasing pressure (McCaffery, 1972). Crude oil-formation water interfacial tension tends to increase only 10 to 20% from atmospheric to saturation pressure (Hocott, 1938). Kusakov et al (1954) found, however, that at pressures above approximately 1,500 psi, continued increase in pressure had no effect on interfacial tension for crude-formation water systems. The data presented here suggest that for pure laboratory systems, increase in pressure can cause oil-water interfacial tension to increase or decrease. For crude oil-formation water systems, the effect of increasing pressure appears to increase interfacial tension slightly and then have little or no effect at pressures above 1,500 psi. In summary, then, the effect of pressure on crude oil-formation water interfacial tension appears small enough that it can be considered negligible.
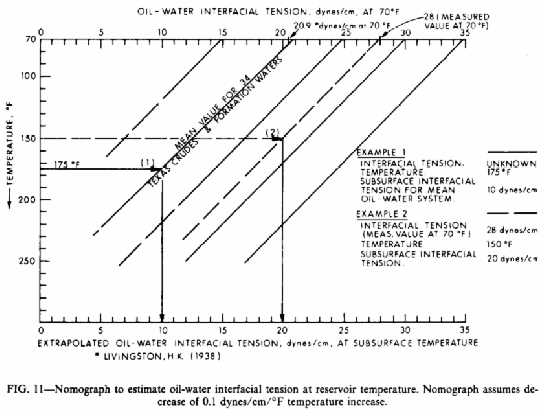
In attempting to quantify oil-water-rock displacement pressure, a value for oil-water interfacial tension in the subsurface must be measured or estimated. Sophisticated laboratory equipment can measure oil-water interfacial tension at reservoir temperature and pressure. If this equipment is not available, interfacial tension can generally be measured at atmospheric conditions in most chemical laboratories. The results of atmospheric interfacial tension measurements must be extrapolated to subsurface temperature and pressure. If no laboratory data are available for the oil-water system in question, then an estimate must be made. Livingston's mean value for 34 Texas crude oils of 21 dynes/cm at 70°F is the best value for medium-density crude oils (30 to 40° API). A value of approximately 15 dynes/cm may be appropriate for higher gravity crude oils (greater than 40° API) with 30 dynes/cm being a reasonable approximation for low-gravity crude oils (less than 30° API). These estimates or measurements at atmospheric temperature (70°F) must be extrapolated to reservoir temperature. It is suggested that the oil-water interfacial tension value at 70°F be decreased 0.1 dynes/cm/°F temperature increase above 70°F. A nomograph (Figure 11) has been prepared to estimate oil-water interfacial tension at reservoir temperature that assumes this linear decrease. Interfacial tension values at very high temperature and pressure are unknown and the nomograph lines do not extend below 5 dynes/cm. A recent paper, however, by Cartmill (1976) suggested that oil-water interfacial tension may continue to decrease at high temperature and pressure and eventually become zero. He postulated that this reduction of interfacial tension at high temperature and pressure may be a mechanism for primary migration of oil from source rocks to carrier beds and reservoirs.
From inspection of the displacement pressure equation (Figure 10) a change in the oil-water interfacial tension will directly affect the displacement pressure for a given oil-water-rock system. From the data presented, subsurface oil-water interfacial tension can range from 5 to 35 dynes/cm. Therefore, the variation of oil-water interfacial tension could affect the displacement pressure of a given rock seven-fold. This effect is obviously very significant in attempting to quantify secondary migration. For example, the seal capacity of a lateral facies change or caprock seal could change by a factor of seven simply by changing the oil-water system present in the subsurface.
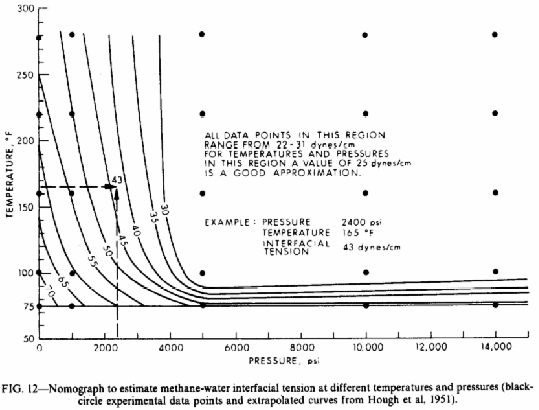
Gas-water interfacial tension: Methane gas-formation water interfacial tension at atmospheric temperature and pressure is approximately 70 dynes/cm. Gas-water interfacial tension varies with the amount of surface-active agents in the water, the amount of heavy hydrocarbons in solution in the gas, temperature, and pressure. Gas-water interfacial tension decreases 5 to 10 dynes/cm/1,000-psi pressure increase depending on the temperature (Hocutt, 1938; Hough et al, 1951). Gas-water interfacial tension decreases with increasing temperature from 0.1 to 1.0 dynes/cm/°F depending on the pressure (Hough et al, 1951). The effects of temperature and pressure on methane-water systems (from Hough et al, 1951) have been combined in a nomograph (Figure 12) to estimate methane-water interfacial tension at any given subsurface temperature and pressure. Estimates from this chart should be sufficiently accurate for exploration application of gas-water interfacial tension to gas-water-rock displacement pressures. Excessive amounts of ethane, propane, and other heavy gases in the gas phase will decrease interfacial tension from that of the pure methane-water systems as shown in the nomograph.
Figure 11. Nomograph to estimate oil-water interfacial tension at reservoir temperature. Nomograph assumes decrease of 0.1 dynes/cm/°F temperature increase.
From Figure 12 it can be seen that methane-water interfacial tensions start as high as 70 dynes/cm at 75° and decrease to approximately 30 dynes/cm at high reservoir temperature and pressure. In contrast, the mean oil-water interfacial tension for 34 Texas crude oils and formation waters was 21 dynes/cm at 70°F (Livingston, 1938). As previously documented, oil-water interfacial tension tends to decrease with increasing subsurface temperature, reducing subsurface oil-water interfacial tension to roughly 10 to 20 dynes/cm. Gas-water interfacial tensions then are generally higher than oil-water interfacial tensions for both surface and subsurface conditions. A gas-water displacement pressure would then be greater than oil-water displacement pressure for the same rock. The high gas-water interfacial tension as compared to oil-water interfacial tension significantly reduces the migration potential of gas through water-saturated rocks in the subsurface. The potential magnitude of this effect is discussed later with appropriate examples.
Wettability can be defined as the work necessary to separate a wetting fluid from a solid. In the subsurface we would generally consider water the wetting fluid and the solid would be grains of quartz in a sandstone, calcite in a limestone, etc. The adhesive force or attraction of the wetting fluid to the solid in any oil-water-rock system is the result of the combined interfacial energy of the oil-water, oil-rock, and water-rock surfaces. Wettability is generally expressed mathematically by the contact angle of the oil-water interface against the rock or pore wall as measured through the water phase. For rock-fluid systems with contact angles between 0 and 90°, the rocks are generally considered water-wet; for contact angles greater than 90°, the rocks are considered oil-wet. Water-wet rocks would imbibe water preferentially to oil. Oil-wet rocks or oil-wet surfaces would imbibe oil preferentially to water. Although a contact angle of 90° has generally been considered the breakover point to an oil-wet surface, Morrow et al (1973) stated that a contact angle of greater than 140° in dolomite laboratory packs was necessary for oil to be imbibed.
Figure 12. Nomograph to estimate methane-water interfacial tension at different temperatures and pressures (black-circle experimental data points and extrapolated curves from Hough et al, 1951).
Water-laid sedimentary rocks are generally considered to be preferentially water-wet owing to the strong attraction of water to rock surfaces and the initial exposure of pore surfaces to water rather than hydrocarbons during sedimentation and early diagenesis. Water is thought by many workers to be a perfect wetting fluid and a thin film of water would coat all grain surfaces. If this is the situation, the contact angle for oil-water-rock systems would be zero. The wettability term in the displacement pressure equation would then be unity, as the cosine of zero is one. If water is not a perfect wetting fluid and the oil-water contact angle is greater than zero, the displacement pressure should theoretically decrease for that oil-water rock system. L. J. M. Smits (1971, personal commun.) has done experimental work on identical size bead packs which suggests that displacement pressures are only slightly affected by changing the oil-water-solid contact angle from 0 to 85°. Similar results were obtained by Morrow et al (1973) on displacement pressure tests in dolomite packs with contact angles ranging from 0 to 140°. These data and the general assumption that most rocks are preferentially water-wet suggest that the wettability term in the displacement pressure equation can be considered unity.
If the rocks are partially oil-wet, then the wettability term can be significant in reducing displacement pressure from that for the water-wet case. In the subsurface, rocks are seldom completely oil-wet but are fractionally oil-wet, that is, some of the grain surfaces are oil-wet and some are water-wet. According to Salathiel (1972), this would most likely occur in reservoir rocks where oil has been trapped and the grain surfaces in the larger pores would be exposed to the surface-active molecules in the oil phase and form an oil film or coating on the grain, making it preferentially oil-wet. The pore surfaces at the smaller pores or in the corners of the larger pores that are not saturated with oil would remain water-wet. Fatt and Klikoff (1959) have determined that when a rock is partially oil-wet there is a reduction in the oil-water displacement pressure for that oil-water-rock system. They suggested that the degree of fractional wettability needed to significantly reduce displacement pressure from that for the water-wet case is greater than 25% oil-wet grain surfaces.
Salathiel (1972) suggested that surface films of oil can produce fractional wettability in oil reservoirs. This has been further documented by Treiber et al (1972) who suggested that in most of the Amoco reservoirs studied, oil wets the rock more strongly than water. Other rocks that might develop grain surfaces that are partially oil-wet are rocks with large quantities of organic material such as source rocks which could adsorb oil surface-active agents. Rocks rich in iron minerals could also be partially oil-wet, as iron can preferentially adsorb surface-active material from crude oils. However, most sedimentary rocks would not contain enough iron minerals to have a significant effect on the overall wettability of the rock.
In summary, oil reservoirs and rocks rich in organic matter such as source rock would be the main exception to the water-wet case in the subsurface. The exploration application of hydrocarbon-water-rock displacement pressure values is generally directed at seal potential of various caprocks, the lateral seal capacity at facies changes in stratigraphic traps, and the migration potential of hydrocarbons through reservoir carrier beds. The likelihood of oil-wet rocks being present in these situations is considered remote. Therefore, it is generally recommended that the wettability term in the displacement pressure equation be considered unity in the quantitative application of displacement pressure values.
The third critical factor in estimating the displacement pressure of a given water-rock-system is the radius of the largest connected pore throats in the rock. By inspection of the displacement pressure equation, the smaller the radius of the connected pore throats in a rock the greater the displacement pressure. The displacement pressure for a reservoir-quality sandstone would be significantly less than that of a fine-grained shale. Specific measurements of pore-size distribution are necessary to quantify secondary migration and entrapment.
Methods for estimating the radius of largest connected pore throats are numerous and varied. Pore-throat size and distribution can be measured visually in thin sections (Aschenbrenner and Achauer, 1960) or from scanning electron microscope photos. Pore geometry and pore-size distribution can also be measured by studying pore casts of leached carbonate rocks (Wardlaw, 1976). These direct measurement procedures have problems in that they generally only measure one plane of the rock and not the three-dimensional relations of one pore to another. Another problem with these methods is that they cannot be used effectively on nonreservoir rocks, which have pore throats too small to measure visually. These rocks are often of interest in hydrocarbon exploration, as they control hydrocarbon trapping. Other methods must be used for these fine-pored rocks.
Berg (1975) provided an empirical, mathematical formula for estimating pore throats for sandstones. Estimates from Berg's formula require that the porosity, permeability, and ideally the grain-size distribution of the sandstone be known. Porosity and permeability data are often available from core analyses, and therefore this approach may be useful in many instances. Berg discussed several examples where he used this method to estimate pore-throat size. However, Berg's method gives only a crude approximation of dominant pore-throat sizes for natural sandstones.
Visual or empirical estimates of pore-throat size as discussed in the preceding section are difficult to make and probably of limited value. A better approach would be to measure the displacement pressure directly. This can be done in the laboratory by injecting a nonwetting fluid into a rock under progressively increasing pressure and measuring the pressure at which a connected filament of nonwetting fluid extends across the sample. This technique would be analogous to the secondary migration of hydrocarbons through a water-saturated rock. Tests of this type are called capillary-pressure tests. Petroleum laboratories have run capillary-pressure tests for years on reservoir core samples. If the injection of the nonwetting fluid is continued incrementally beyond the pressure needed to establish a connected filament of nonwetting fluid across the sample, then the entire capillary properties or pore-size distribution of the rock can be determined.
Laboratory capillary pressure tests on rock samples can use almost any kind of fluid for the wetting and nonwetting phases. Oil or gas can be used for the nonwetting fluid and water for the wetting fluid. Although tests with these fluids would obviously be the best for petroleum exploration applications, they are difficult and time consuming. Purcell (1949) developed and demonstrated the validity and expediency of measuring rock capillary properties by mercury injection. Mercury capillary tests are now standard procedure for most private and commercial laboratories. Results from these tests can provide valuable exploration and production exploitation data. Results and application of capillary pressure test data have been reported in the literature by numerous authors (Stout, 1964; Harms, 1966; Smith, 1966; Roehl, 1967).
Mercury Capillary Pressure Tests
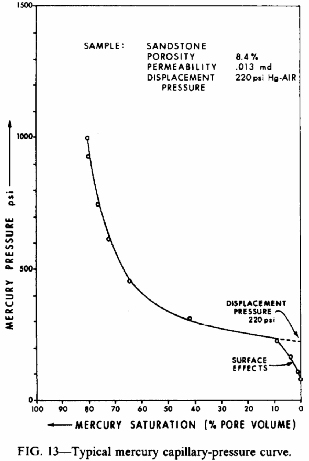
A brief discussion of mercury capillary pressure tests is warranted before proceeding. A perm-plug-type core sample or large sample cuttings are placed in a calibrated pressure chamber. Irregular shaped samples can be used in a mercury test because the volume of the sample is accurately measured during the test. Mercury (nonwetting phase) is introduced into the cell and completely surrounds the sample. Mercury then is forced into the sample by incrementally increasing the pressure on the mercury. The cumulative volume of mercury injected at each pressure is a measure of the nonwetting-phase saturation. This procedure is continued until the injection pressure reaches some predetermined value (usually 1,500 psi for normal laboratory equipment). The curve in Figure 13, a plot of mercury pressure versus volume of mercury injected, expressed as percent pore volume occupied, is the result of this process.
Mercury capillary pressure curves such as those in Figure 13 can be used to estimate displacement pressures, irreducible water saturations, the thickness of the hydrocarbon-water transition zone, and permeability. The irreducible water saturation is that percent of the pore space that hydrocarbons cannot penetrate and is often called ineffective porosity. This porosity is an important property of reservoir-rock petrophysics.
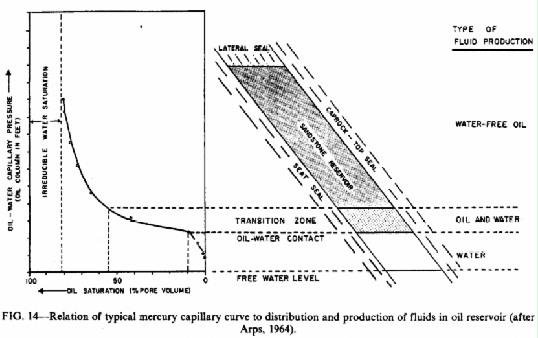
In a static oil reservoir as illustrated in Figure 1, the oil saturation as a percent of oil space will increase upward through the oil column as the forces of buoyancy overcome the forces of capillary pressure. As oil saturation increases, the ability of oil to flow to the well bore increases to the point where water-free oil production occurs. The interval from water production at the base of the oil-saturated reservoir to water-free oil production higher in the reservoir is termed the "oil-water transition zone." The thickness of the oil-water transition zone will depend on the capillary properties of the rock and the fluid properties of the system. This relation has been illustrated in Figure 14 (after Arps, 1964). Arps also discussed application of these principles in evaluating tilted oil-water contacts and the problem of minimum structural or stratigraphic closure required for water-free production in a petroleum reservoir.
Displacement pressure, which is critical in estimating hydrocarbon seal capacity, has been previously defined as that pressure required to form a continuous filament of nonwetting fluid through the largest connected pore throats of the rock. Purcell (1949) and Thomas et al (1967) have discussed the use of mercury capillary pressure curves in estimating rock permeability.
The significance of all these capillary rock properties has been discussed in detail by Aufricht and Koepf (1957), Arps (1964), Stout (1964), and numerous other authors. The conversion of mercury pressure information to hydrocarbon-water pressure is discussed in detail later in the paper.
The validity of mercury tests to estimate various rock parameters, displacement pressure, irreducible water saturation, hydrocarbon-transition zones, and permeability (Purcell, 1949) is a function of the scale of heterogeneity of the rock. If most of the pores of the rock are small in comparison to the size of the test sample, then the results should be quite good. If, for example, the rock in question is known to be a vuggy carbonate rock or a fractured sandstone, where the very important larger pores of the rock cannot be adequately sampled, then the validity of the results should be poor. Therefore, all geologic knowledge available to a particular problem should be applied in choosing samples for mercury tests and in applying the results.
Displacement pressure is one of the principal subjects of this paper, as it is the pressure which will determine the minimum buoyant pressure needed for secondary migration. A reasonably accurate estimate of displacement pressure for various rock samples is then critical to quantifying of secondary hydrocarbon migration principles for exploration purposes.
Figure 13. Typical mercury capillary-pressure curve.
Figure 14. Relation of typical mercury capillary curve to distribution and production of fluids in oil reservoir (after Arps, 1964).
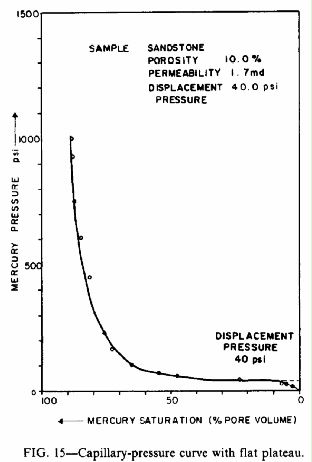
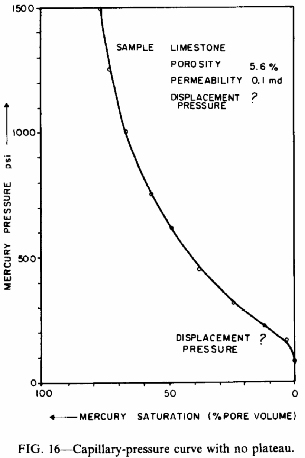
For migration to occur a continuous hydrocarbon filament must extend through the interconnected pores of a water-saturated rock. In estimating displacement pressures from capillary pressure curves, it has been assumed that a continuous nonwetting filament would occur somewhere on the capillary plateau. This approach seems quite adequate where the capillary plateau is nearly flat as illustrated in Figure 15. Note that the pressure difference between saturations of 10 and 50% is quite small and, regardless of the minimum nonwetting saturation, the chance for error in estimating displacement pressure is minimal. However, for rocks with steep capillary plateaus or no plateau as illustrated in Figure 16, the displacement pressure cannot be accurately estimated without knowing the critical nonwetting-phase saturation needed to form a continuous nonwetting filament through the rock. This saturation is analogous to the critical gas saturations required for gas breakthrough in depletion-type reservoirs containing a spreading oil. Critical saturations needed for migration have been reported by Rudd and Pandey (1973) to be generally less than 10% for shales and carbonate rocks. Additional direct measurements of critical saturation were needed to determine how accurately displacement pressures could be estimated for various rock types from readily available standard mercury capillary pressure curves.
Laboratory Tests of Displacement Pressure
Direct measurements of displacement pressure and critical saturation at breakthrough were conducted with two sets of equipment. A nitrogen-water system was used where nitrogen is displaced through water-filled rock samples under a confining pressure. The nitrogen pressure is increased in increments against one end of the rock sample, and the amount of effluent water at the other end is monitored. A constant and higher flow of effluent occurs at that nitrogen pressure when a nitrogen filament is continuous across the length of the sample. A high pressure (5,000 psi) mercury apparatus was also used where the formation of a continuous thread of mercury across the length of the sample is detected by electrical conduction. The mercury system was superior to the nitrogen system because it was significantly faster and because breakthrough was distinct and instantaneously determined.
Figure 15. Capillary-pressure curve with flat plateau.
Figure 16. Capillary-pressure curve with no plateau.
Sandstones, shales, and chalks were used in the breakthrough
studies. Four samples were tested with the nitrogen-water system.
After completing these nitrogen-water tests, the samples were
cleaned and standard mercury capillary pressure tests were run on
the same samples. The measured nitrogen displacement or
breakthrough pressures were converted to mercury capillary
pressure values by using a conversion factor of 5X (Purcell,
1949) to compare the results to other samples tested with mercury
equipment. Five samples were tested with the high-pressure
mercury cell. Results from both techniques are reported in Table
1.
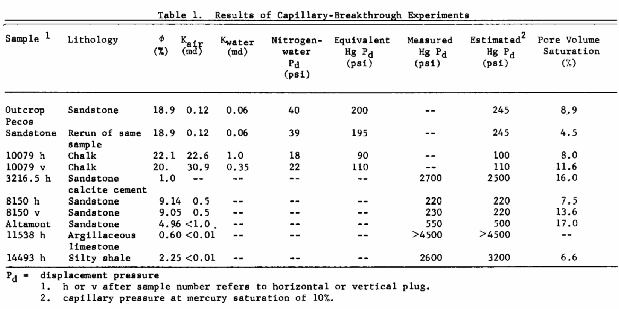 |
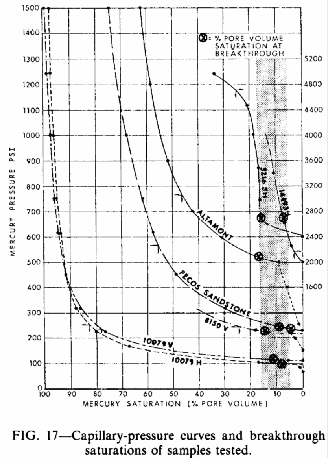
The nonwetting phase saturation needed to establish a connected filament across the length of the samples ranged from 4.5 to 17% of the rock pore volume. The average saturation for all the samples tested was 10%. The capillary curve for each sample and the percent saturation at breakthrough is illustrated in Figure 17 by the large "X" on the capillary curve.
From inspection of the capillary pressure curves in Figure 17, it is obvious that a wide spectrum of pore-size distribution was tested in the nine samples. The critical saturation for this varied rock sampling, however, has a relatively restricted range, 4.5 to 17%. From this sampling then, it would appear that migration can occur in most rock types at a nonwetting phase saturation of approximately 10% of the rock pore volume. These data suggest that displacement pressures could be estimated from standard mercury capillary pressure curves by determining the mercury pressure on the capillary curve at 10% mercury saturation. Sophisticated equipment as used in these experiments would not be necessary to get workable values for displacement pressure for any given rock. The determination from this study that secondary hydrocarbon migration can occur at hydrocarbon saturations of around 10% can be applied in exploration. Saturations as low as 10% may be difficult to detect as a subsurface show in normal drilling operations. However, hydrocarbon shows with only 10% saturation may provide important exploration information in identifying hydrocarbon-transition zones in trapped accumulations and in defining hydrocarbon migration paths. Another interesting aspect of these data can be applied to bright-spot geophysics. Flowers (1976) demonstrated that a small percentage of free gas in a reservoir, too small to affect the resistivity measurements on bore hole logs, should produce a strong velocity change and hence a bright-spot amplitude anomaly. From the data presented here we can infer that the minimum saturation need for migration is approximately 10%. Gas saturation values of 5 to 10% are enough to cause bright-spot anomalies. These gas accumulations, then, probably represent locally generated gas bubbles that have not formed the connected gas filament needed to migrate and form a commercial deposit. Accumulation of this type could occur in off-structure positions as pointed out by Flowers (1976).
Capillary Properties of Drill Cuttings
In practice, exploration application of data from mercury capillary pressure tests has been considered limited to situations where regular-shaped core samples were available. However, Purcell (1949) in his original paper stated that capillary properties of irregular-shaped rock chips and drill-cutting-size samples can be measured accurately and without difficulty by mercury capillary pressure equipment. He measured the capillary properties of two reservoir sandstones that were broken into drill-cutting-size chips. Permeability estimated from capillary pressure data by a devised formula shows good agreement between data derived from rock chips and those derived from core samples.
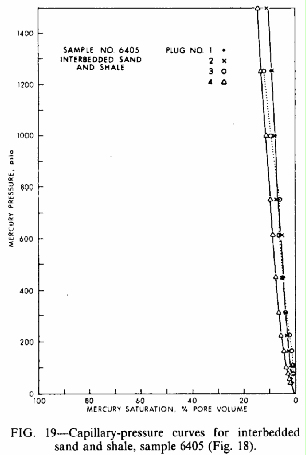
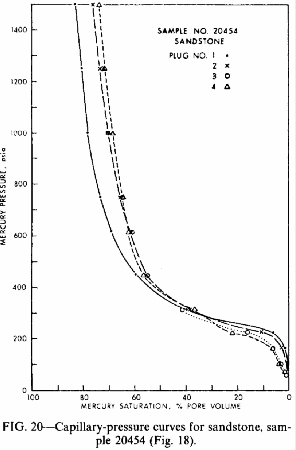
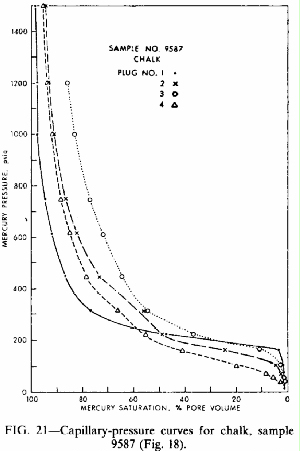
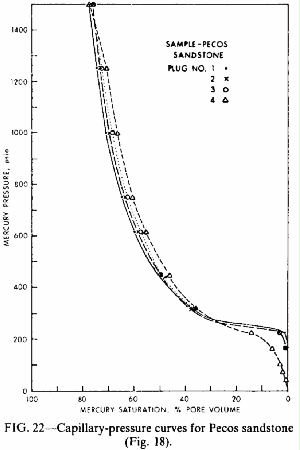
Additional tests have been completed on four rock samples of different lithologies to evaluate further the reliability of mercury capillary properties derived from drill-cutting-size samples. For these tests three sandstones and one chalk were used. Four adjacent perm plugs were cut from each sample and numbered one through four. The four perm plugs from each sample were then measured for porosity and permeability to determine the heterogeneity in adjacent samples (Table 2). The numbered plugs for each sample were broken into various size rock chips (Figure 18). Standard mercury capillary pressure tests were made on each plug or group of rock chips. The capillary pressure curves derived from each sample are shown in Figure 19, Figure 20, Figure 21, and Figure 22.
These curves suggest that there is generally good agreement
between data derived from full size core chips and those derived
from rock chips of various sizes. Detailed examination, however,
suggests that the capillary plateau appears to decrease slightly
with the decreasing size of the rock chips. The irreducible water
saturation seems to increase with a decrease in the size of the
rock chips. The capillary pressure at 10% saturation is listed in
Table 2 for comparison of displacement-pressure estimates from
various size rock chips.
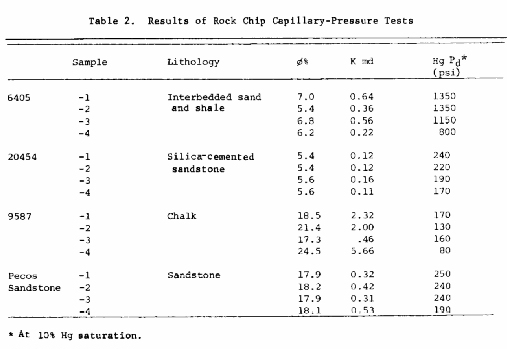 |
These data suggest that capillary properties of irregular-shaped rock chips as small as drill-cutting-size samples can be measured with workable accuracy with standard mercury capillary pressure equipment. The smaller the sample, however, the more likely the capillary plateau and the displacement pressure estimated at 10% saturation are to be less than that measured from a full-size perm plug. The rock types in which these techniques would be applicable would be those rocks that have a scale of heterogeneity smaller than the rock chips used.
In conclusion, capillary properties provide useful information in exploration or production studies, and usable data can be obtained from full-diameter cores, side-wall cores, or drill cuttings.
Conversion of Mercury Data to Hydrocarbon-Water Data
Quantitative application of mercury capillary pressure data to subsurface conditions requires the conversion of mercury capillary pressure values to subsurface hydrocarbon-water capillary pressure values. This conversion factor can be accomplished by using the following equation (Purcell, 1949):
![]()
where Pchw = capillary pressure for hydrocarbon water system, ![]() = interfacial
tension of hydrocarbon and water in dyne/cm,
= interfacial
tension of hydrocarbon and water in dyne/cm, ![]() = contact
angle of hydrocarbon and water (wettability),
= contact
angle of hydrocarbon and water (wettability), ![]() = interfacial
tension of mercury plus air (surface tension energy), and
= interfacial
tension of mercury plus air (surface tension energy), and ![]() = contact
angle of mercury and air against the rock.
= contact
angle of mercury and air against the rock.
Figure 17. Capillary-pressure curves and breakthrough saturations of samples tested.
The variability of subsurface hydrocarbon-water interfacial
tension and methods of estimating these values have been
discussed in the previous sections. As previously discussed, the
contact angle of hydrocarbon-water systems is generally
considered to be zero and the cos ( ![]() ) becomes
unity. The interfacial tension of mercury and air is 480 dynes/cm
at laboratory conditions. The contact angle between mercury and a
solid is 40°, making the cos
) becomes
unity. The interfacial tension of mercury and air is 480 dynes/cm
at laboratory conditions. The contact angle between mercury and a
solid is 40°, making the cos ![]() m
equal to 0.776.
m
equal to 0.776.
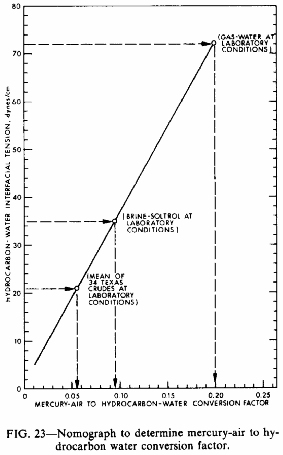
Subsurface values for hydrocarbon-water capillary pressure can be calculated by estimating the subsurface hydrocarbon-water interfacial tension and plugging it into the equation. A simple graphic solution to determine the conversion factor, from mercury to oil water or gas water, is provided in Figure 23. Once a conversion value has been estimated from Figure 23, this value is then multiplied by the mercury capillary pressure value in question. For example: (1) subsurface oil-water interfacial tension 21 dynes/cm; (2) mercury air to hydrocarbon-water conversion factor 0.055 (Figure 23); (3) mercury displacement pressure 200 psi; (4) oil-water displacement pressure = 200 x 0.055 = 11 psi.
Calculations of Hydrocarbon Column Heights
It has been suggested that in quantifying secondary hydrocarbon migration and entrapment the calculation of vertical hydrocarbon volume a given rock pore system can seal or trap would be important in the exploration process. This can be accomplished by using the equation of Smith (1966):
![]()
where H = maximum vertical hydrocarbon column in feet above the 100% water level (oil-water contact) that can be sealed; PdB = subsurface hydrocarbon-water displacement pressure (psi) of the boundary bed; PdR = subsurface hydrocarbon-water displacement pressure (psi) of the reservoir rock; pw = subsurface density (g/cc) of water; ph = subsurface density (g/cc) of hydrocarbon; 0.433 = a unit's conversion factor.
The variables in this formula and methods used in determining the appropriate values have been discussed in previous sections. The only variable not directly plugged into this formula is hydrodynamics. A simple nomograph (Figure 9) to estimate the percent effect on seal capacity can be used to quantify the effects of hydrodynamics. The percent effect on seal capacity from the nomograph can be multiplied by the results of the equation and added or subtracted to the original value depending on whether the hydrodynamic flow is updip or downdip.
One variable in this formula may be modified depending on the desired results. The value of PdR or displacement pressure if used in the formula will give the vertical hydrocarbon column to the 100% water level (Figure 1). The explorationist may wish to know the vertical height to the point of water-free oil production rather than the 100% water level. This can be done by determining the subsurface hydrocarbon-water capillary pressure for water-free oil production for the reservoir rock in question (Arps, 1964;Figure 14).
Figure 18. [Grey Scale Plate Available] Photographs of samples tested to determine capillary properties of drill cuttings.
Figure 19. Capillary-pressure curves for interbedded sand and shale, sample 6405 (Figure 18).
Figure 20. Capillary-pressure curves for sandstone, sample 20454 (Figure 18).
Figure 21. Capillary-pressure curves for chalk, sample 9587 (Figure 18).
Figure 22. Capillary-pressure curves for Pecos sandstone (Figure 18).
A complete sample calculation of the potential hydrocarbon seal capacity of a given rock is helpful in illustrating this process.
The following properties are given:
 |
The calculation then is:
The hydrodynamic effect = 28 ft x 0.50 = + 14 ft.
The total seal capacity = 28 ft + 14 ft = 42-ft oil column.
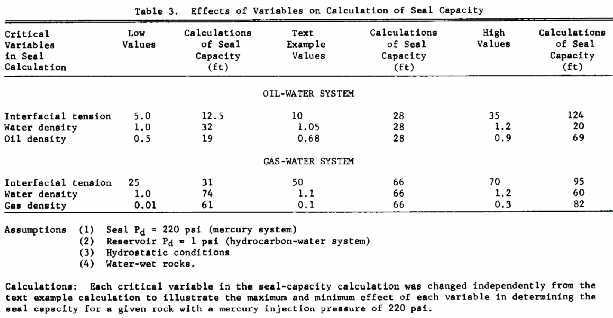
The previous sections this paper discuss the variables involved in secondary migration and entrapment and how estimates of values for these variables can be made with information generally available in petroleum exploration. To show the importance of these values in the calculation of seal capacity, maximum and minimum values for each critical variable were substituted in the sample calculation with all other values held constant (Table 3). This table shows that a 220-psi mercury displacement pressure rock could seal from a minimum of 12.5 ft to a maximum of 124 ft of oil column depending on the value of the variables used. For gas-water systems the same 220-psi rock could seal a gas column of from 31 to 95 ft.
Table 3 illustrates the importance of the critical nongeologic parameters in quantifying secondary hydrocarbon migration and entrapment. The table also shows that a given rock can seal a larger gas column than an oil column. The reason for this unexpected relation is that the high interfacial tension of the gas-water system compared to oil-water systems counteracts the higher buoyant pressure generated by gas-water systems.
 |
The thrust of the first half of this paper has been to discuss how to determine the minimum hydrocarbon column required to migrate through a given rock. If the displacement pressure for the rock in question can be measured and the subsurface conditions for the test case are known, calculations can be made following the outlined procedure. This hydrocarbon column height can be useful in determining minimum requirements for migration in reservoir rocks and to estimate trap capacities of exploratory prospects by quantifying caprock and lateral-seal capacity. The same procedures can be used to quantify other aspects of secondary hydrocarbon migration. Hydrocarbon shows in any rock can be interpreted quantitatively if capillary properties and oil saturations are known. The capillary pressure of the rock at the saturation in question can be related to a maximum hydrocarbon column that must be associated with the hydrocarbon show. This approach is analogous to estimating seal capacity as illustrated in the given example. Data of this type can be used to estimate the oil-water contact in developing oil or gas fields and in quantitatively interpreting hydrocarbon shows in near-miss wildcat wells. Detailed examples of these techniques are discussed in the following sections.
Figure 23. Nomograph to determine mercury-air to hydrocarbon water conversion factor.
Seal capacity estimates of various rock types can be useful at several different levels of exploration activity. In a virgin basin the identification or regional caprock seals to migrating hydrocarbons can be important in migration and reservoir-change studies. When a structural prospect has been identified, the caprock seal capacity of the formation immediately overlying the hydrocarbon-charged reservoir is important in determining the producibility of the prospect. In stratigraphic traps the lateral-seal capacity of the rock type updip from a charged reservoir will determine the vertical hydrocarbon column the lateral facies change can trap.
The prediction of caprock seals to migrating hydrocarbons on a prospect or regional scale should be based on all available geologic data. Lithologically, the perfect caprock seal would have very small pores (to trap a large hydrocarbon column), and be very ductile so that it would not yield by brittle fracturing. Stratigraphically, the perfect seal would be thick and laterally continuous across the basin or area in question. Regional salt beds and marine clay shales fit these criteria and are generally considered as regional caprock seals to continuous-phase hydrocarbon migration. Where these more obvious caprock seals are not present, prediction of local or regional caprock seals requires additional data and the quantitative application of the principles of secondary hydrocarbon migration.
Estimation of caprock seal capacity in exploration settings requires two types of information. The first piece of information needed is the capillary properties of the caprock in question. If these data are known, the hydrocarbon column that the pore system of the rock can seal or trap can be calculated. The next type of information needed is some estimate of the mechanical properties of the rock (e.g., brittleness) and the structural setting of the rock layer in question. Rock mechanical properties can be measured directly in the laboratory or estimated empirically from published data. The structure setting can be determined by subsurface mapping and seismic sections. These data are necessary to determine whether the rock layer in question is likely to fail by brittle fracturing. If brittle fracture is dominant in the rock layer, it will not be an effective caprock seal, even if the pore system of the rock can seal a large hydrocarbon column. In the simplified problem discussed in the next paragraph all the rock layers in the example will be considered ductile and only the pore system of the rocks in question is considered in predicting seal capacity.
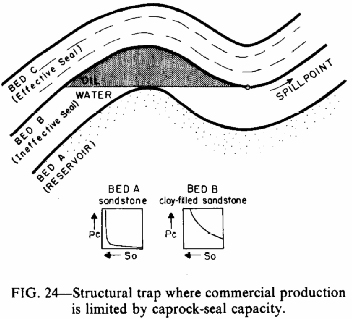
A simplified problem is presented in Figure 24 to serve as an example in caprock prediction. An anticlinal prospect has been identified as an exploration target. A good quality reservoir (bed A) that is thought to be charged with hydrocarbons is overlain by two distinct rock layers (beds B and C) which are not reservoir-quality rock. If bed B is a seal to migrating hydrocarbons, then the reservoir (bed A) will be filled with hydrocarbons before the spillpoint of the trap is reached and a commercial accumulation should be present. If bed C is a hydrocarbon seal and bed B is not, the trap would spill hydrocarbons updip before the reservoir quality rock of bed A is saturated with oil. Migrating hydrocarbons would be trapped in this second situation but the accumulation would be noncommercial because bed B, which is saturated with hydrocarbons, cannot produce at economic rates.
In attempting to solve this problem (Figure 24), the seal capacity of the pore systems of rock types in beds B and C must be estimated. If rock samples are available, this can be done by direct measurement of displacement pressure as previously discussed. Calculations of vertical hydrocarbon seal capacity of each rock type in the appropriate subsurface environment can be made. If the pore network of the rock type in bed B has a low seal capacity, or if it is a brittle rock, there is the possibility that the defined prospect may be a noncommercial trapped hydrocarbon accumulation. This type of information should then be considered in the exploration-decision process.
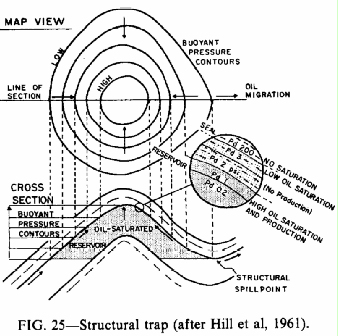
The example just described considers the situation where two distinct lithologies of considerable thickness overlie a potential reservoir rock. In settings where the rocks overlying the potential reservoir are thin bedded, the chance of one ductile bed with a high displacement pressure acting as a seal is quite good. As pointed out by Hill et al (1961), in an oil column trapped by simple anticlinal closure, the buoyant force is directed vertically upward and perpendicular to the bedding. If the first thin bed overlying the reservoir has a low displacement pressure, and the bed immediately above it has a high displacement pressure that can act as a seal for the accumulation, then oil will be trapped in the commercial reservoir rock (Figure 25).
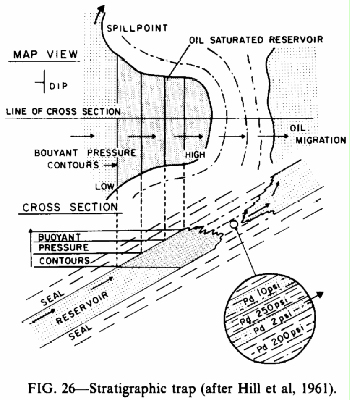
Stratigraphic traps: For stratigraphic traps we have the added problem of lateral-seal capacity in addition to caprock-seal capacity discussed for structural traps. Stratigraphic traps as a general class include all trapped hydrocarbon accumulations that are formed by a displacement pressure barrier along a reservoir carrier bed. Any lateral termination of a vertically sealed reservoir-quality rock charged with migrating hydrocarbons would then be a commercial stratigraphic trap. This definition would include reservoir-rock lateral terminations owing to depositional facies changes, diagenetic facies changes, faults, unconformities, etc. Stratigraphic traps include all traps except simple anticlinal closure and tilted oil-water contacts on structural terraces which can form traps that would not hold hydrocarbons in the hydrostatic case as pointed out by Hubbert (1953).
A simplified stratigraphic trap has been diagramed in Figure 26 to compare and contrast structural and stratigraphic traps. For stratigraphic traps, Hill et al (1961) pointed out that the buoyant force of the oil column is directed updip parallel with bedding rather than perpendicular to bedding as in the structural trap (Figure 25). In contrast to the structural trap, the lowest displacement pressure bed at the lateral termination of the reservoir will determine the stratigraphic-trap capacity. The prediction of trap capacity for stratigraphic traps must consider both the seal capacity of the rocks above and below the reservoir and the seal capacity of rocks laterally equivalent to the reservoir. As shown in Figure 26, thin continuous beds with low displacement pressure can be the controlling factor in stratigraphic-trap capacity.
Figure 24. Structural trap where commercial production is limited by caprock-seal capacity.
Figure 25. Structural trap (after Hill et al, 1961).
In quantification of lateral-seal capacity, it is then important to know the displacement pressure of the rock at the updip termination of the reservoir, and the vertical and lateral continuity of the potential lateral seal. If a particular facies has been mapped as a potential lateral seal and rock samples are available, quantitative estimates of seal capacity can be made by running mercury capillary pressure tests and making the calculations for the hydrostatic or hydrodynamic case, whichever is appropriate (Figure 26). In sampling a potential lateral seal, numerous samples should be taken vertically across the zone that is laterally equivalent to the reservoir. The rock with the lowest displacement pressure will act as the controlling lateral seal depending on its lateral continuity both updip and downdip. Berg (1975) has documented several cases where quantitative attempts at lateral-seal-capacity estimates have proved to be quite accurate.
Quantitative Hydrocarbon Show Interpretation
Another situation where attempts to quantify secondary hydrocarbon migration and entrapment can be useful in exploration is in the interpretation of hydrocarbon shows. In a laterally continuous reservoir rock that is charged with hydrocarbons we would generally expect to encounter two types of subsurface hydrocarbon shows. Type one would be a continuous-phase hydrocarbon occurrence that is associated with a trapped hydrocarbon accumulation of finite size. The other type would be a residual hydrocarbon stain along a migration path. In a very simplified approach to show interpretation, we can consider a flow of oil or gas while drilling, drill-stem testing, or production testing, as an indication of a trapped accumulation of hydrocarbons, because oil or gas along a migration path would be at residual saturation with no permeability to hydrocarbons. If we can determine that a given show is associated with a trapped accumulation of hydrocarbons we can estimate the probable areal extent of the accumulation by quantitatively applying the principles of secondary hydrocarbon migration and entrapment.
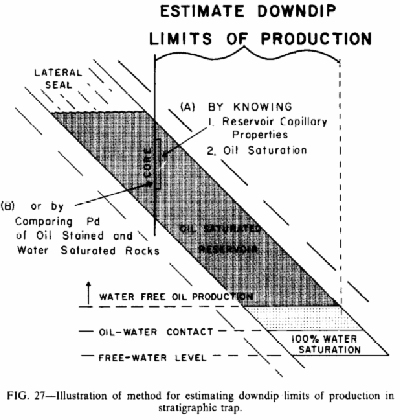
There are several situations where an explorationist can estimate the extent of a given accumulation. Let us examine what could be done when an exploratory well was drilled in the center of a structural or stratigraphic trap (Figure 27). Once the well in Figure 27 is completed, the next step is to develop the field. One key question during development is where is the producible oil-water contact or how far downdip can wells be drilled before excessive water production will be encountered. Assuming uniform reservoir rock, this can be estimated by applying the mechanics of secondary migration and entrapment. Two approaches can be used to estimate the depth to water-free oil production. If the saturation of the reservoir rock is accurately known from log calculations and the capillary properties of the reservoir rock are known, calculations of the oil column required to account for the buoyant pressure required to reach that given saturation can be made. The procedure involved here is exactly as discussed in the calculation of seal capacity except the capillary pressure at reservoir saturation is used instead of the displacement pressure of the reservoir. Another approach that can be used if a continuous core is available through the reservoir is to run capillary pressure tests on rock samples where oil-saturated rocks are adjacent to water-saturated rocks. By comparing the oil column needed to saturate stained and unstained samples the oil column in the reservoir can be estimated. For example, an oil-stained rock that has a displacement pressure equivalent to a 30-ft oil column may be immediately overlain by a rock with a displacement pressure equivalent to 40 ft. The oil column present downdip from this sample would be greater than 30 ft but less than 40 ft. In complex stratigraphic traps, dry holes with oil shows in noncommercial reservoir rock can be drilled in the middle of a commercial oil accumulation. If a well of this type were drilled as an initial exploratory test, the extent of accumulation in the downdip direction could be estimated by the method just described.
Figure 26. Stratigraphic trap (after Hill et al, 1961).
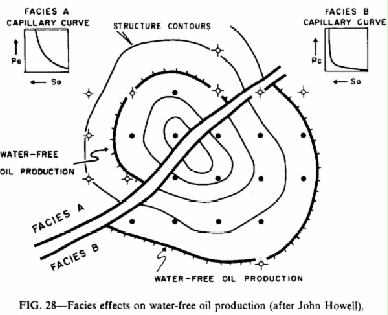
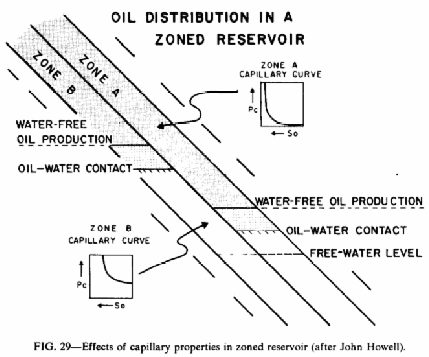
Field development can also be aided by an understanding of capillary properties, particularly if there is a strong variation in the capillary pressure of different facies within a producing zone or between different producing beds with a common oil-water contact. Figure 28 illustrates the potential variation in the productive oil-water contact where there are two facies with widely different capillary properties crossing the crest of a closed structure. Figure 29 illustrates the possible variation of the producible oil-water contact in a structure trap with two producing beds that have widely different capillary properties. This diagram assumes a common free-water level and communication between the different producing beds. Quantitative estimates of producible oil-water contacts can be made during field development (if the capillary properties of different facies or producing zones are known) by following the procedures outlined previously.
Another situation where quantitative show interpretation could be helpful is in the updip portion of subtle stratigraphic traps. Stratigraphic traps with a gradual updip change from reservoir-quality rock to the updip seal, will have a zone where the oil cannot be produced economically because of poor quality reservoir rock and/or low oil saturation. This zone, diagramed in Figure 30, has been termed the waste zone by Bob Dunham of Shell (personal commun., 1973), as the oil in this zone is wasted and cannot be produced. The recognition of waste zones is critical to the exploration for stratigraphic traps if we are to improve our oil-finding techniques. If the oil-stained zone in this well can be determined to be part of a trapped accumulation of hydrocarbons, then calculations can be made to determine the extent of the accumulation downdip. The approach would be the same as that described in the previous section. Calculations can be made by using capillary properties and oil saturation of a given oil-saturated rock or by comparing the displacement pressure of oil-stained and unstained samples.
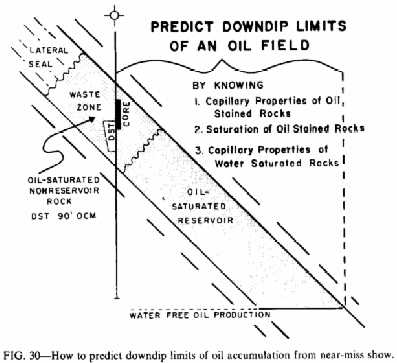
Figure 27. Illustration of method for estimating downdip limits of production in stratigraphic trap.
Figure 28. Facies effects on water-free oil production (after John Howell).
Figure 29. Effects of capillary properties in zoned reservoir (after John Howell).
The third situation where quantitative show interpretation can assist in exploration is where an exploratory well is drilled in the oil-water transition zone of a commercial reservoir (Figure 31). Wells in this position test oil with uneconomically high water cuts. The obvious direction for an offset well is updip to get a higher oil saturation due to increased buoyant forces. The question is at what height above the first well will water-free oil production or oil production with low water cuts be encountered.
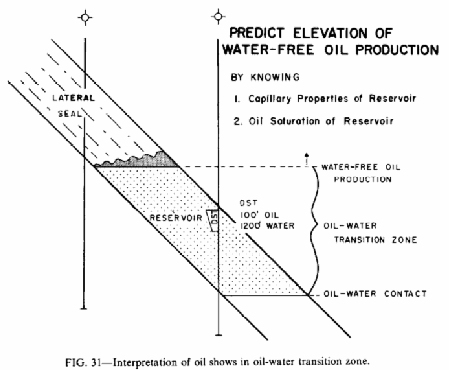
This question can be answered if the saturation and capillary properties of the reservoir rock are known. The height above the well in question that is required for commercial water-free oil production can be calculated following the same procedure previously described. The concept behind this approach has been discussed by Arps (1964). The question could be critical in situations where the height needed for commercial production is greater than the elevation to be gained by an additional test in the case of a structural accumulation. In the case of a stratigraphic trap this question can be important if the height needed above the transition-zone well is greater than the elevation available as defined by dry holes located in the lateral seal of the accumulation as illustrated in the example (Figure 31).
MIGRATION AND ENTRAPMENT MODEL
The mechanical principles of secondary migration can logically be applied to developing a model for secondary hydrocarbon migration and entrapment. In summary, these principles state that if the driving force (buoyancy) of a continuous-phase hydrocarbon accumulation exceeds the retarding forces (displacement pressure) of a rock acting as a barrier to migration, oil or gas will displace water from the confining pore throats and migrate as a continuous filament through the largest connected pore throats of the rock.
To develop a workable secondary-migration model, a simplified geologic environment can be used as an illustration. Consider a laterally continuous homogeneous reservoir rock overlain by a high-displacement-pressure caprock seal and underlain by a hydrocarbon source rock. Oil or gas expelled from the source rock will begin to accumulate at the source rock-reservoir boundary. The method of primary migration is not inferred here but these principles can be applied whenever the expelled oil or gas occur as a continuous phase in the rock on a scale from droplets to larger connected filaments. As oil or gas accumulates at the source rock-reservoir boundary, the buoyant force of a continuous oil or gas filament will eventually exceed the displacement pressure of the reservoir rock and the hydrocarbon phase will then migrate vertically upward through the reservoir rock until it encounters the overlying caprock seal. The vertical oil or gas column necessary to migrate vertically upward through the reservoir rock will depend on the density of the hydrocarbon and water phases, the size of the largest connected pore throats of the reservoir, the interfacial tension, and the wettability of the hydrocarbon-water-rock system. These variables have been discussed in detail with methods to quantify the vertical hydrocarbon column needed for migration.
Figure 30. How to predict downdip limits of oil accumulation from near-miss show.
Using average values of oil and water densities, interfacial tension, and pore throat sizes measured from thin sections, Aschenbrenner and Achauer (1960) calculated that it takes a continuous vertical oil filament of 7½ ft to migrate vertically upward through the average reservoir carbonate rock. For a water-wet medium-grained sandstone they calculate that the vertical oil column needed for migration would be approximately 1 ft using average densities and interfacial tensions. Direct measurements of displacement pressure for 23 sandstone reservoirs and six carbonate reservoirs suggest that critical vertical oil columns needed for migration range from 1 to 10 ft for sandstones and 3 to 5 ft for the carbonate reservoirs. These calculations have assumed water-wet rocks, oil-water interfacial tension of 30 dynes/cm, hydrostatic conditions, and a buoyancy gradient of 0.1 psi/ft. Both these studies suggest that the continuous-phase vertical oil column needed for oil to migrate through average reservoir rocks at subsurface condition ranges from roughly 1 to 10 ft. Although these numbers would vary for gas and also for oil as the densities of the fluids, the interfacial tension, wettability, and hydrodynamic conditions vary, they can be used as workable numbers in constructing a migration model.
In the model the oil or gas would migrate vertically upward through the reservoir until it reached the reservoir seal boundary where it would spread out along this interface. Now an additional volume of oil must accumulate to migrate laterally updip along the reservoir seal boundary. The lateral length of a continuous oil or gas filament required to reach the critical vertical oil or gas column will depend on the dip of the beds. The steeper the dip the shorter the length of the hydrocarbon filament needed to obtain the critical vertical hydrocarbon column height required for updip migration. Aschenbrenner and Achauer (1960) made a graph to determine the minimum length of hydrocarbon filament required at various dips to obtain the 7½-ft vertical oil column to migrate through their average carbonate reservoir. This additional volume of oil is obtained by the continual addition of oil being expelled from the source rock and migrating vertically upward through the reservoir. When the critical length of hydrocarbon column is obtained, oil will migrate laterally updip through the reservoir.
Figure 31. Interpretation of oil shows in oil-water transition zone.
As migration occurs laterally updip through the reservoir the oil saturation could be as low as 10%, as this is the minimum saturation needed to migrate across the length of 1-in. permeability plugs tested in the laboratory. The hydrocarbon filament will migrate through only the upper few feet of the carrier system and the remaining reservoir section will be barren of hydrocarbons (Figure 32). At the base of the migrating hydrocarbon filament small isolated droplets will be left behind as residual oil as it migrates upward. These shows of oil can be called "migration-path shows" and can provide important exploration information. The amount of oil left behind will depend on the initial saturation. The greater the initial saturation, the greater the residual saturation. Residual saturations along migration paths are thought to be on the order of 20% or less as hydrocarbon saturations during migration range from 10 to 30%. These residual droplets of oil are permanently trapped by capillary forces. The soluble portion of this residual oil can be dissolved in the surrounding water phase and dispersed by diffusion. Enough residual oil should be left behind as residual saturation along any migration path to create an oil show in samples or cores. In a uniform reservoir this migration residual stain should be located immediately below the caprock seal and only the upper few feet of reservoir should have any detectable oil show. Oil migration paths may be difficult to detect in drilling for this reason. Migration of gas as a separate phase through a reservoir may leave no residual saturation as a separate phase because of the high solubility of gas which may permit all the capillary-trapped gas to dissolve and dissipate by diffusion.
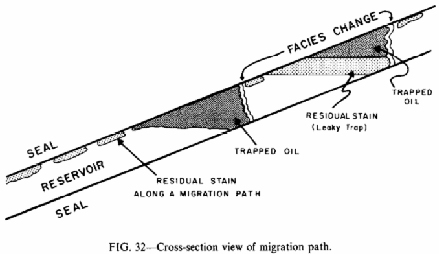
The hydrocarbon filament will migrate laterally updip perpendicular to strike in a tortuous manner, seeking the path of least work by moving through the rocks with the largest connected pore throats or lowest displacement pressure. This tortuous movement, if considered from map view, will leave some rocks with a residual oil saturation where migration has occurred and rocks immediately adjacent will be completely barren of oil. This fact should be considered when evaluating the likelihood of an 8-in. drill hole encountering a migration path in a potential reservoir carrier bed. This relation has been pictured in Figure 33.
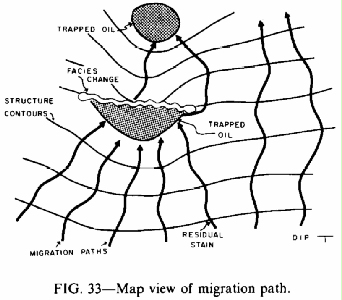
As the migrating filament loses oil in the form of residual oil or gas at the base of the filament, the length of the hydrocarbon filament will be shortened and the buoyant force will be reduced. Eventually, the buoyant force of the filament will be reduced to the point that it will no longer be able to overcome the capillary resistant force of the pores of the reservoir carrier bed. Migration will cease at this point until another hydrocarbon filament migrates updip to the stalled filament and then migration will continue. This continuous pulsating process will continue as long as oil is being added downdip. This can be accomplished by continual generation of oil in the source rock or by addition of oil due to remigration. Oil or gas can continue to migrate laterally updip or vertically through any rock section so long as the buoyant force of the hydrocarbon column is greater than the resistant force of the carrier bed. Therefore, there are no physical limits to the distance oil or gas can migrate laterally or vertically in a given geologic situation.
Figure 32. Cross-section view of migration path.
Expanding the simplified model to the scale of a petroleum basin, we can envision oil being expelled at points of maturity within the basin and migrating updip, perpendicular to strike, through the reservoir carrier bed. The migrating front of oil or gas can be concentrated in areally small zones or migration paths by structural anomalies such as anticlinal axes plunging into the basin or by facies variations within the reservoir carrier bed. Oil or gas will be trapped along a migration path whenever a closed anticlinal trap or a displacement pressure barrier is present within the reservoir carrier bed. These traps can be of any size. For structure-type traps, size will depend on the size of the anticlinal feature and the vertical-seal capacity of the caprock. For stratigraphic traps the size will depend on the lateral-seal capacity of the displacement pressure barrier and the size and geometry of the displacement pressure barrier. Oil or gas will continue to migrate laterally updip into a trap along a migration path until the trap is full. In the simplified model with a reservoir carrier bed overlain by a high-displacement-pressure caprock seal, any structural trap (Figure 25) will fill to its geometric spillpoint and then oil will spill updip and continue to migrate laterally updip through the reservoir carrier bed. As oil or gas continues to migrate updip into the trap, oil will spill out of the trap and migrate updip in a continual process. If the vertical oil or gas column that can be contained by the caprock seal in a structural trap is less than the oil or gas column at the spillpoint of the trap, oil or gas will leak vertically through the caprock seal and will not spill updip.
For stratigraphic traps (Figure 26) the trap may fill to the point that oil or gas can spill around the displacement-pressure barrier somewhere along the strike of the reservoir carrier bed. This is analogous to a structural trap filling to its geometric spillpoint and spilling oil updip. Another possibility for the stratigraphic trap is that, as the trap is filling, the buoyant force of the hydrocarbon column could exceed the resistant force of the displacement pressure and oil could leak laterally updip through the displacement-pressure barrier and continue to migrate updip through the reservoir carrier bed. Stratigraphic traps can then be considered both to spill oil or gas updip or leak oil or gas updip through the displacement-pressure barrier or lateral seal.
Oil or gas accumulations along a migration path are permanently trapped as long as geologic conditions remain constant. If there is a change in any parameter that is critical to the entrapment of a certain volume of oil or gas, then remigration as a continuous phase will occur. Such things as a change in dip, hydrodynamic conditions, densities of the hydrocarbon or water phase, sealing capacity of the caprock or lateral seal could cause remigration of oil or gas as a continuous-phase fluid out of the trap. If geologic conditions remain constant the oil or gas will remain permanently trapped and there will be no gradual leakage of bulk-phase hydrocarbons out of the trap. Hydrocarbons can, however, escape from the trap, but not as continuous droplets or filaments. If the trapped hydrocarbons are soluble they can be dissolved in the water phase within the reservoir and dissipated by diffusion from the trap or be swept away in solution in a moving-water phase. Oil molecules are generally quite insoluble and loss of oil from a trap by solution is probably minimal, except in the case of shallow reservoirs in an active hydrodynamic setting. Gas, particularly methane, is quite soluble in formation waters and gas loss by solution and diffusion could be significant in the case of trapped hydrocarbon gas. Gas in solution can diffuse through any porous water-saturated rock and this type of gas loss and migration from reservoirs, migration paths, and source rocks may account for the high-amounts of gas in solution in formation waters in some petroleum basins.
Figure 33. Map view of migration path.
In the migration model developed we have suggested that oil migrating into a trap will be permanently trapped as long as geologic conditions at the time of entrapment remain constant. This implies that the displacement or breakthrough pressure of a caprock seal in a structural trap or a lateral seal in a stratigraphic trap is independent of time and will not gradually leak droplets or filaments of continuous-phase oil or gas. Thomas et al (1967), in their study of threshold displacement pressures required to store natural gas in the subsurface, agree that threshold displacement pressures are independent of time. In their experiments they subjected two different water-saturated rock samples to gas pressure less than their threshold pressures for 3 to 10 days and observed no movement of water from the cores over this period of time. This laboratory work correlates with theoretical work that states that no continuous-phase migration will occur unless the buoyant pressure in the oil or gas column is greater than the resistant force of the confining seal or barrier.
In the migration model it has also been discussed that when the buoyant pressure of the oil or gas column exceeds the displacement pressure of the confining porous-rock barrier, oil or gas will displace water from the confining pore throats and migrate as a continuous oil or gas filament through the pore throats of the rock. The next question in further defining the model is how much oil or gas will leak through the constricting pore throat or throats before water will move back into the throat and snap off or collapse the oil or gas filament. How much oil or gas will escape from a trap when leakage through a seal occurs? Will the barrier allow the whole accumulation to migrate updip or will it leak one drop at a time?
For a migrating hydrocarbon filament to be snapped off, water must be able to flow into the confining pore throat and collapse the oil or gas filament. The confining pore throat would then be filled with water and the barrier to migration would, in effect, be resealed. Roof (1970) has calculated that for snap-off to occur in circular pores the leading edge of the oil or gas interface must extend past the confining pore throat for a distance of at least seven times the radius of the pore throat. For snap-off to occur in his model the pore would have to be large in relation to the size of pore throat. Roof then modeled migration through a stack of doughnut-shaped pores and determined that snap-off would not occur as oil or gas migrated through this series of pores. On the scale of pores then it does not appear that traps or barriers would leak oil or gas one drop at a time.
How much oil or gas would leak through a barrier to migration before snap-off occurred and the rock resealed? Petroleum Research Corp. (1959) has determined that for the oil or gas filament to collapse, capillary pressure must be reduced to between one-fourth and one-half the pore-entry pressure. The reduction of capillary pressure required before water can be imbibed back into the rock and collapse the hydrocarbon filament is documented by the hysteresis effect during capillary injection and withdrawal (Pickell et al, 1966). In their studies mercury was injected into rock samples and the mercury saturation increased with increasing pressure. However, when the capillary pressure was reduced, no air was imbibed back into the sample until the pressure was reduced significantly below the entry pressure.
These data suggest that for snap-off or collapse in an oil or gas filament migrating through a rock to occur, the capillary pressure must be reduced to approximately one-half of the displacement pressure. The capillary pressure between the hydrocarbon and water phase could be reduced in our migration model by one-half simply by having approximately one-half of the oil or gas filament migrate through a displacement-pressure barrier. As the filament of oil or gas migrates through the displacement pressure barrier, snap-off would occur whenever capillary pressure or buoyant pressure was reduced enough that water could flow into the critical pore throats and collapse the oil or gas filament. This is a simplification of a complex phenomenon but, from the standpoint of developing a migration model, we can assume that when the buoyant force of an oil or gas filament exceeds the displacement pressure of a barrier along a migration path, a large part of the trapped oil or gas filament will migrate or leak through the barrier before collapse or snap-off. When snap-off occurs the barrier has been resealed and migration for the oil or gas filament downdip from the barrier will be halted. For simplicity, let us assume that for intergranular and intercrystalline porosity the amount of oil or gas allowed to leak through the displacement-pressure barrier will be approximately one-half of the trapped oil or gas column. The exception to this assumption would be for vugular porosity types which, as pointed out by Roof (1970), would snap off or collapse after only a few drops had migrated through the controlling pore throat.
From the standpoint of an explorationist, a trap along a migration path that has leaked oil or gas updip will reseal after approximately one-half of the trapped hydrocarbon column has migrated updip. The next logical question in our migration model then is: when a barrier has resealed, what is its displacement or threshold pressure? This problem has been investigated by Thomas et al (1967). Their gas-breakthrough experiments suggest that a rock can be resealed by water moving back into the rock. With sufficient time for water to move back into the rock, they suggest that a rock can reseal at or near its original displacement or threshold pressure. Theoretical calculations considering a single confining pore throat also suggest that once the oil or gas filament has collapsed and water has been imbibed into the critical pore throat, the displacement pressure of the pore throat would be the same as the original displacement pressure before leakage. Therefore, in our migration model, we can assume that stratigraphic traps that leak oil or gas updip through a lateral seal can reseal and refill to their original capacity if the resealed barrier holds.
The migration model we have developed has taken us to the point of the first major trap along a reservoir carrier bed or migration path. As oil or gas continues to migrate updip beyond the first major trap, what will happen and how will oil and gas be distributed in long-range migration? Gussow (1954) was the first to deal with this problem. Gussow discussed how oil and gas will be expelled from a source, coalesce to form continuous slugs in a reservoir carrier bed, and migrate updip perpendicular to structure, honoring the lowest displacement-pressure rocks in its path. The slugs will join along major structural noses or permeability barriers to form "rivers" of oil. This updip movement of hydrocarbons as streams in carrier beds to the final condition of entrapment is known as secondary migration.
Gussow (1954) stated that the lowest trap along a migration path will be filled first, then the trap structurally higher, and so on. When there is a series of structural traps that spill petroleum updip, there is the potential for differential entrapment of oil and gas when the two phases are present. As illustrated in Figure 34 and discussed by Gussow, if both oil and gas are present in a trap as separate phases, gas will occupy the upper part of the trap and oil the lower. As the accumulation continues to fill with oil and gas migrating into the trap, gas will rise to the top of the structure and when the structure is full to the spillpoint, oil will be spilled updip. As the trap continues to fill with gas, oil will be spilled updip until the trap will be completely filled with gas and can no longer trap oil. As illustrated in the diagram, this would result in oil filling the higher traps and gas the lower traps along a migration path. Gussow listed numerous examples of the differential entrapment of oil updip from gas along migration paths along which a series of structural traps are present. He suggested that this relation will hold except where there is strong downdip hydrodynamic flow. As discussed by Hubbert (1953), in a structural trap filled with two phases (oil and gas), under hydrodynamic conditions oil can be flushed out of the trap and gas left behind. This situation would produce gas updip from oil and is an exception to Gussow's case.
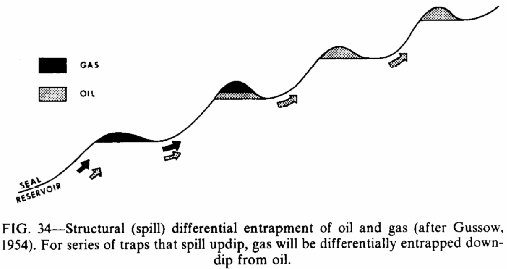
Figure 34. Structural (spill) differential entrapment of oil and gas (after Gussow, 1954). For series of traps that spill updip, gas will be differentially entrapped downdip from oil.
Let us now consider the situation where the traps along a migration path are a series of displacement-pressure barriers that will hold a certain hydrocarbon column and then leak hydrocarbons updip through the barrier before the trap is filled to its stratigraphic spillpoint. Petroleum Research Corp. (1960) discussed this situation in their report on differential entrapment. Figure 35 illustrates the effect of leak differential entrapment (compare to spill differential entrapment, Figure 34). When oil and gas are present as separate phases in a stratigraphic trap, gas will be at the updip part of the trap and will be trying to break through the barrier. As the trap fills and the buoyant pressure increases, gas will leak out through the barrier first when the displacement pressure of the barrier is reached. As discussed previously, a large slug of gas and some oil will migrate through the barrier before it reseals. As migration continues, gas will eventually be the only phase migrating updip through the displacement pressure or permeability barriers along the migration path. This produces a situation where gas is differentially trapped updip from oil, which is exactly the opposite of spill differential entrapment.
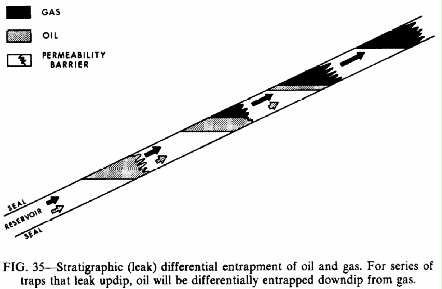
When a migration path consists of both structural and stratigraphic traps, the distribution of hydrocarbons can become quite complex because of the opposite effect of leak and spill differential entrapment.
Other factors such as the depth and timing of oil and gas generation must also be considered when interpreting the distribution of oil and gas along migration paths. For example, shallow gas high up along a migration path that appears to be due to stratigraphic leak differential entrapment may actually be indigenous biogenic gas rather than gas that has migrated long distances and been differentially trapped updip from oil. Thermal generation of oil and gas will also pose problems in interpreting patterns of oil and gas distribution. Thermal generation models suggest that oil is generated first and expelled, then gas is generated and expelled. This sequence of generation and migration could cause gas to be distributed downdip from oil, which is analogous to structural spill differential entrapment. Another complication to consider is that, whenever the structural dip of a carrier bed is changed, remigration and further adjustments in the distribution of oil and gas will occur.
Differential entrapment of oil and gas along migration paths may cause dramatic chemical changes in oil composition. Hobson (1962) and Silverman (1965) gave detailed discussions of this phenomenon. In summary, they suggested that small but measurable changes occur as oil migrates as a single phase through reservoir carrier beds. These changes due to secondary migration of a single oil phase cannot explain the markedly different chemistry of some oils that are thought to be genetically related. These larger differences in composition of genetically related oils are speculated to be caused by phase separations of oil and gas during migration and the process was called separation-migration by Silverman (1965). For separation-migration to occur, two phases, oil and gas, must be present in the trap. The gas phase must escape, leaving the liquid phase behind. As the gas phase migrates updip to a lower pressure, retrograde condensation can occur and form a liquid and gas phase from the gas phase that was separated by migration. The liquid oil formed by this process will be compositionally distinct from the parent oil left behind. Silverman suggested that the gas phase could be separated from the oil phase by fracturing the caprock so that only gas escapes from the trap. This type of separation is analogous to stratigraphic differential entrapment as discussed in the preceding section where a trap leaks through a displacement-pressure barrier. Gas will be at the updip portion of the trap and when the buoyant pressure of the oil and gas column exceeds the displacement pressure of the controlling barrier to migration, a large slug of gas will leak through the barrier and the barrier will then reseal. This would separate an oil and a gas phase and create the chemical changes discussed by Silverman.
Figure 35. Stratigraphic (leak) differential entrapment of oil and gas. For series of traps that leak updip, oil will be differentially entrapped downdip from gas.
The compositional changes during normal secondary migration and separation-migration are considered relatively unimportant to the explorationist because of the lack of predictive value.
The processes of secondary hydrocarbon migration and entrapment are well understood physical processes. The distribution of oil and gas in the subsurface can be examined in a logical quantitative fashion by following a few basic principles and using data generally available in petroleum exploration and development. A thorough understanding of these processes can be very useful in all phases of the search for oil and gas.
In the exploration for new oil and gas reserves these principals define critical factors needed to predict the location of entrapped oil or gas along a migration path. For structural traps the critical factors are the seal capacity of the reservoir caprock, the structural configuration at the base of the seal, and the tilt of the oil-water contact if a hydrodynamic condition is present. For stratigraphic traps the location, configuration, and seal capacity of a lateral barrier to oil or gas migration along a carrier bed are critical. The seal capacity of the barrier in terms of vertical hydrocarbon column will be affected by the density of the hydrocarbon and water phases, the hydrodynamic conditions in the carrier bed, the pore-throat sizes of the barrier, the interfacial tension of hydrocarbon-water phase and the wettability of the rock. The dip of the reservoir will not affect seal capacity but will affect the volume of hydrocarbons trapped.
Once a commercial field has been located, the principles of secondary migration and entrapment can be useful in field development. The updip and downdip limits of the accumulation can be calculated quantitatively from normally available well data and the information can be used in development drilling.
Wherever the processes of secondary migration and entrapment are used for prediction in the search for oil and gas, they should be used in conjunction with all available geologic information, as they cannot stand alone and provide meaningful data.
Arps, J. J., 1964, Engineering concepts useful in oil finding: AAPG Bull., v. 48, p. 157-165.
Aschenbrenner, B. C., and C. W. Achauer, 1960, Minimum conditions for migration of oil in water-wet carbonate rocks: AAPG Bull., v. 44, p. 235-243.
Aufricht, W. R., and E. H. Koepf, 1957, The interpretation of capillary pressure data from carbonate reservoirs: Jour. Petroleum Technology, v. 9, no. 10, p. 53-56.
Berg, R. R., 1975, Capillary pressure in stratigraphic traps: AAPG Bull., v. 59, p. 939-956.
Berry, F. A. F., 1958, Hydrodynamics and geochemistry of the Jurassic and Cretaceous Systems in the San Juan basin, N. W. New Mexico and S. W. Colorado: PhD thesis, Stanford Univ.
Cartmill, J. C., 1976, Obscure nature of petroleum migration and entrapment: AAPG Bull., v. 60, p. 1520-1530.
Cordell, R. J., 1972, Depths of oil origin and primary migration: a review and critique: AAPG Bull., v. 56, p. 2029-2067.
Dickey, P. A., 1975, Possible primary migration of oil from source rock in oil phase: AAPG Bull., v. 59, p. 337-345.
Fatt, I., and W. A. Klikoff, 1959, Effect of fractional wettability on multibase flow through porous media: AIME Petroleum Trans., v. 216, p. 71-77.
Flowers, B. S., 1976, Overview of exploration geophysics--recent breakthroughs and challenging new problems: AAPG Bull., v. 60, p. 3-11.
Gussow, W. C., 1954, Differential entrapment of oil and gas: a fundamental principle: AAPG Bull., v. 38, p. 816-853.
Harms, J. C., 1966, Stratigraphic traps in a valley fill, western Nebraska: AAPG Bull., v. 50, p. 2119-2149.
Hill, G. A., W. A. Colburn, and J. W. Knight, 1961, Reducing oil finding costs by use of hydrodynamic evaluations, in Economics of petroleum exploration, development and property evaluation: Englewood, N.J., Prentice-Hall, Inc., p. 38-69.
Hobson, G. D., 1962, Factors affecting oil and gas accumulations: Inst. Petroleum Jour., v. 48, no. 461, p. 165-168.
Hocott, C. R., 1938, Interfacial tension between water and oil under reservoir conditions: AIME Petroleum Trans., v. 32, p. 184-190.
Hough, E. W., M. J. Rzasa, and B. B. Wood, 1951, Interfacial tensions of reservoir pressures and temperatures, apparatus and the water-methane system: AIME Petroleum Trans., v. 192, p. 57-60.
Hubbert, M. K., 1953, Entrapment of petroleum under hydrodynamic conditions: AAPG Bull., v. 37, p. 1954-2026.
Kusakov, M. M., N. M. Lubman, and A. Yu. Koshevnik, 1954, Oil-water and oil-gas interfacial tensions under in-situ conditions: Neftyanoye Khozyaystvo, v. 32, no. 10, p. 62-69 (trans. by Assoc. Tech. Services, Inc.).
Leverett, M. C., 1941, Capillary behavior in porous solids: AIME Petroleum Trans., v. 142, p. 152-169.
Livingston, H. K., 1938, Surface and interfacial tension of oil-water systems in Texas oil sands: AIME Tech. Paper 1001.
McCaffery, F. G., 1972, Measurement of interfacial tensions and contact angles at high temperature and pressure: Jour. Canadian Petroleum Technology, v. 11, no. 3, p. 26-32.
McNeal, R. P., 1961, Hydrodynamic entrapment of oil and gas in Bisti field, San Juan County, New Mexico: AAPG Bull., v. 45, p. 315-329.
McNeal, R. P., 1965, Hydrodynamics of the Permian basin, in Fluids in subsurface environments: AAPG Mem. 4, p. 308-326.
Meyers, J. D., 1968, Differential pressures, a trapping mechanism in Gulf Coast oil and gas fields: Gulf Coast Assoc. Geol. Socs. Trans., v. 18, p. 56-80.
Michaels, A. S., and E. A. Hauser, 1950, Interfacial properties of hydrocarbon-water systems: Jour. Phys. and Colloidal Chemistry, v. 55, p. 408-421.
Morrow, N. R., P. J. Cram, and F. G. McCaffery, 1973, Displacement studies in dolomite with wettability control by octonoic acid: AIME Petroleum Trans., v. 255, p. 221-232.
Petroleum Research Corp., 1959, Oil and gas migration through reservoir rocks: Denver, Colo., Research Rept. A-14.
Petroleum Research Corp., 1960, Exploration applications of oil and gas differential entrapment: Denver, Colo., Research Rept. A-15.
Pickell, J. J., B. F. Swanson, and W. B. Hickman, 1966, Application of air-mercury and oil-air capillary pressure data in the study of pore structure and fluid distribution: SPE Jour., v. 6, no. 1, p. 55-61.
Price, L. C., 1976, Aqueous solubility of petroleum as applied to its origin and primary migration: AAPG Bull., v. 60, p. 213-244.
Purcell, W. R., 1949, Capillary pressure--their measurements using mercury and the calculation of permeability therefrom: AIME Petroleum Trans., v. 186, p. 39-48.
Roehl, P. O., 1967, Stony Mountain (Ordovician) and Interlake (Silurian) facies analogs of recent low-energy marine and subaerial carbonates, Bahamas: AAPG Bull., v. 51, p. 1979-2031.
Roof, J. G., 1970, Snap-off of oil droplets in water-wet pores: AIME Petroleum Trans., v. 249, p. 85-90.
Roof, J. G., and W. M. Rutherford, 1958, Rate of migration of petroleum by proposed mechanisms: AAPG Bull., v. 42, p. 963-980.
Rudd, N., and G. N. Pandey, 1973, Threshold pressure profiling by continuous injection: AIME-SPE Paper 4597, 7 p.
Salathiel, R. A., 1972, Oil recovery by surface film drainage in mixed-wettability rocks: AIME-SPE Paper 4104.
Silverman, S. R., 1965, Migration and segregation of oil and gas, in Fluids in subsurface environments: AAPG Mem. 4, p. 53-65.
Smith, D. A., 1966, Theoretical considerations of sealing and non-sealing faults: AAPG Bull., v. 50, p. 363-374.
Stone, D. S., and R. L. Hoeger, 1973, Importance of hydrodynamic factor in formation of Lower Cretaceous combination traps, Big Muddy-South Glenrock area, Wyoming: AAPG Bull., v. 57, p. 1714-1733.
Stout, J. L., 1964, Pore geometry as related to carbonate stratigraphic traps: AAPG Bull., v. 48, p. 329-337.
Thomas, L. K., D. L. Katz, and M. R. Tek, 1967, Threshold pressure phenomena in porous media: AIME-SPE Paper 1816, 12 p.
Treiber, L. E., D. L. Archer, and W. W. Owens, 1972, A laboratory evaluation of the wettability of fifty oil-producing reservoirs: AIME Petroleum Trans., v. 253, p. 531-540.
Wardlaw, N. C., 1976, Pore geometry of carbonate rocks as revealed by pore casts and capillary pressure: AAPG Bull., v. 60, p. 245-257.