Click to view article in PDF format.
GCHow 4-D Seismic Monitoring Works*
Roger Anderson1
Search and Discovery Article #40615 (2010)
Posted October 22, 2010
*Adapted from the Geophysical Corner column, in AAPG Explorer, September 1996, prepared by the author. Appreciation is expressed to M. Ray Thomasson of the AAPG Geophysical Integration Committee and to Larry Nation, AAPG Communications Director, for their support of this online version.
1Lamont-Doherty Earth Observatory, New York, NY ([email protected])
More than half the oil and gas in every field in the world is bypassed, even when using the best of technologies. However, we are in the midst of a profound technological transition within the industry that promises to significantly improve these recovery efficiency percentages. Because we are experiencing it first-hand, it is sometimes hard to discern the magnitude of this change. During the 1980s and on into the mid-1990s, the upstream industry as a whole was testing, adapting, and finally accepting 3-D seismic surveys as the cost-effective tool for both exploration and enhanced recovery.
Most 3-D seismic acquisitions were over old fields, ironically, and so from the very beginning, geologists were seeing changes in gas/oil/water that had occurred since production began—usually long before the first 3-D survey was shot. The 3-D surveys were, in fact, the first 4-D, or time dependent seismic monitoring projects.
|
|
4-D is 3-D seismic imaging done many times over the same volume of earth, and then integrated with other forms of time-dependent information in a field. Examples of other 4-D datasets include:
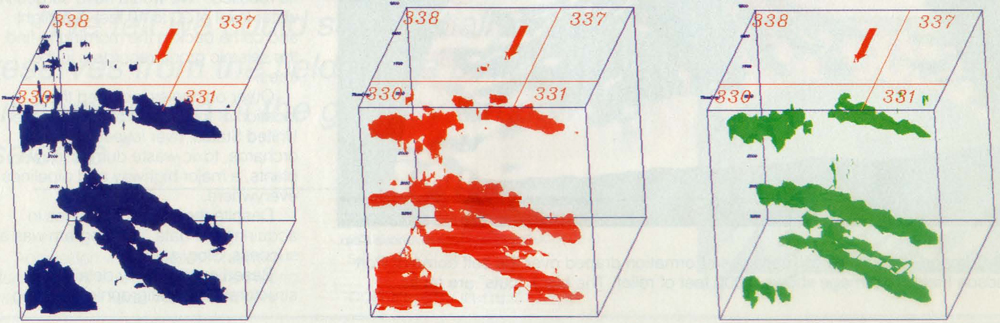
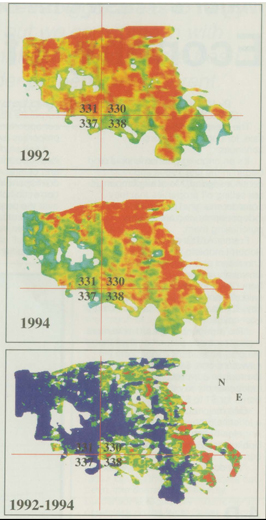
The transition from 2-D to 3-D has resulted in improved recovery efficiencies that have increased from 25 percent to 30 percent of oil-in-place with 2-D control, to 40-50 percent with 3-D coverage. British Petroleum expects the industry’s most ambitious 4-D project in the North Sea’s Foenhaven Field to improve those statistics to 65-75 percent (November 1995 EXPLORER; Petroleum Engineer International, January, 1996). Time-lapsed images of producing reservoirs are acquired through the repeated acquisition of 3-D seismic surveys to track oil’s movement over time. The location and amount of bypassed oil can be identified, so that new wells can be drilled to recover much more than was previously possible. The promise of 4-D monitoring is that, given the right geological condition, we might now remotely sense the real pattern of drainage of oil inside reservoirs beneath the surface. The removal of large volumes of oil and gas from a reservoir produces velocity and density changes that can be remotely detected from the surface. The seismic response to changes in reservoir properties can vary from field to field. Depletion produces pressure drops that in the Pleistocene Gulf of Mexico produce amplitude brightening. Petrophysics and careful seismic interpretation can predict these changes. An acoustic response “wedge” can be generated by synthetic seismic modeling for each field. The impedance (velocity times density) changes of the rock matrix are held fixed, and the pressure drop from production is added to the density changes from changes in gas/oil/water mix to predict the acoustic response expected. Each reservoir in the field then defines a separate pathway along the surface of the wedge over time. That is what 4-D seismic monitoring tries to detect in the real earth example. Reservoir drainage also can be monitored through 4-D application of Pulsed-Neutron cased-hole logs compared with the seismic waveforms from each bin around the well, where amplitude changes over time can be examined. These amplitude changes must first be carefully normalized to each other, and not only amplitude, but other attributes such as phase, frequency, and, particularly, impedance, can be examined. Drainage should agree between the two techniques at the well bin location. Then, seismic changes from other bins away from well control can be examined. Real-World, 4-D Drainage Changes The utility of 4-D seismic monitoring is demonstrated in Eugene Island 330 Field of offshore Louisiana, using a single discrete reservoir for illustration (Figure 1 and Figure 2a, b, & c). Four generations of 3-D seismic surveys have been acquired over the Eugene Island 300 Field, first in 1985, then in 1988, 1992, and again in 1994. These datasets contain seismic snapshots of the field as it has been drained of more than 100 million barrels of oil equivalents. The 4-D study was begun in 1992. At that time, a traditional gravitational water drive was assumed to be sweeping the studied reservoir. A 1992 snapshot shows considerable seismic amplitudes (shown in red) remaining downdip of supposed oil/water contact. After the 3-D seismic study of 1992 was acquired, there were only three wells active in the fault block. A new 3-D seismic survey was acquired in 1994, and it clearly shows drainage, or dimmed amplitudes evidenced by the color change from red to green, caused by production in the intervening years. About 2.4 million barrels of oil equivalents were produced from these areas and about 600 acres were dimmed. These drained areas are shown in blue in Figure 2c. Assuming a 100-foot thick pay sand with 30 percent porosity and an increase in salt water of 30 percent that would require that each acre foot produce about 400 bbl/acre foot, quite reasonable for clean Pleistocene sands in the Gulf of Mexico. New Wells to Recover Bypassed Oil The bypassed oil remaining after 1994 will require the placement of yet another well into the fault block. Therein lies the power of 4-D. Each new well recovers an additional percentage of oil-in-lace, increasing the ultimate recovery efficiency. Amplitudes drained by the new well are predicted to account for an additional two million barrels. In another two years, that well will water out, and additional amplitudes are predicted to remain requiring another well and so on into the future. Four-D seismic monitoring offers the hope of controlling and optimizing oil drainage in real-time, and thus of recovering more oil from old fields at a time when the world will surely need these added supplies. Contributing to this report was Liqing Xu, Albert Boulanger, and Wei He, all of Lamont-Doherty.
Copyright © AAPG. Serial rights given by author. For all other rights contact author directly. |