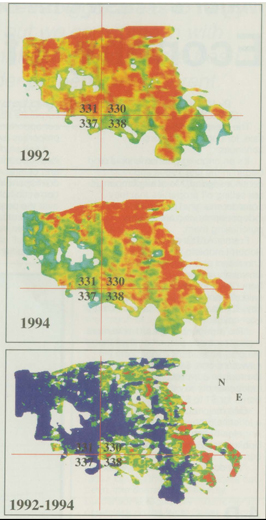
Figure 2. Demonstration of 4-D seismic changes seen in Eugene Island 330 Field from 1992 to 1994. Red is increased amplitude; blue is dimmed amplitudes over time; and green is sustained, high amplitudes of bypassed pay.
Figure 2. Demonstration of 4-D seismic changes seen in Eugene Island 330 Field from 1992 to 1994. Red is increased amplitude; blue is dimmed amplitudes over time; and green is sustained, high amplitudes of bypassed pay.