![]() Click to view article in PDF format. (5.61 MB)
Click to view article in PDF format. (5.61 MB)
Sand Distribution Pattern and Depositional Model of Kopili Formation (Eocene) with Special Reference to Sequence Stratigraphic Framework from North Assam Shelf, Assam-Arakan Basin, India*
S.K. Roy Moulik1, H.J. Singh1, R.K. Singh Rawat1, Md. S.Akhtar1, S. Mayor1, and M. Asthana1
Search and Discovery Article 50196 (2009)
Posted August 11, 2009
*Adapted from manuscript prepared for oral presentation at AAPG Annual Convention, Denver, Colorado, June 7-10, 2009
1Oil and Natural Gas Corporation Limited, Dehradun,India ([email protected])
This study has incorporated enhanced quality 3D data (PSTM/PSDM) along with high resolution biostratigraphic and available G&G inputs to bring out the sand distribution pattern and building of a depositional model within sequence stratigraphic framework of the upper part of middle Eocene to upper Eocene Kopili Formation for better understanding of the reservoir distribution for the entire North Assam Shelf.
Sequence stratigraphy has an important built-in interpretation component, which addresses issues such as the reconstruction of the allogenic controls at the time of sedimentation, and predictions of facies architecture in yet unexplored areas. It is a process response model, thus leading to the interpretation of paleoenvironments which are much more critical for sequence stratigraphy than for lithostratigraphy. As a result, current sequence stratigraphic concept is being used globally in place of lithostraigraphic concept, in particular, to bring out the facies distribution pattern and depositional model in basinal scale analysis.
The North Assam Shelf is in the mature stage of ![]() exploration
exploration![]() for relatively shallow horizons and has established an oil province from
Neogene (Oligocene and Miocene) age. A good number of wells have been drilled
through deeper sections(Eocene and Paleocene) and has established leads from
strata of Paleogene age.
for relatively shallow horizons and has established an oil province from
Neogene (Oligocene and Miocene) age. A good number of wells have been drilled
through deeper sections(Eocene and Paleocene) and has established leads from
strata of Paleogene age.
Kopili Formation (middle to late Eocene) of North Assam
Shelf could be further subdivided into three higher order sequences; viz.,
Sequence I, II, and III, primarily based on logs and available biostratigraphic
and paleobathymetric data as the ![]() seismic
seismic![]() imaging is found to be very poor
within the Kopili section. Sequence I is the lowermost sequence; Sequence III
is the uppermost sequence, whereas Sequence II is the intermediate sequence
identified within Kopili Formation. Two types of system tracts (viz., TST
(Transgressive System Tract) and HST (High stand System Tract)) are found to be
present in each sequence. System tract analysis has brought out facies
distribution pattern and barrier bar- lagoon - tidal inlet - tidal bar - bay
head delta depositional model has been envisaged for Kopili Formation in the
entire North Assam Shelf. This model will certainly aid in proper planning for
imaging is found to be very poor
within the Kopili section. Sequence I is the lowermost sequence; Sequence III
is the uppermost sequence, whereas Sequence II is the intermediate sequence
identified within Kopili Formation. Two types of system tracts (viz., TST
(Transgressive System Tract) and HST (High stand System Tract)) are found to be
present in each sequence. System tract analysis has brought out facies
distribution pattern and barrier bar- lagoon - tidal inlet - tidal bar - bay
head delta depositional model has been envisaged for Kopili Formation in the
entire North Assam Shelf. This model will certainly aid in proper planning for
![]() exploration
exploration![]() of Kopili Formation in North Assam Shelf.
of Kopili Formation in North Assam Shelf.
|
The study area lies in the North Assam Shelf of Assam and Assam-Arakan Basin, northeast India. (Figure 1). The North
Assam Shelf is in the mature stage of
Assam Shelf, a part of Assam-Arakan Basin covering an area of about 40,000 square kilometers, has long been established as a hydrocarbon-producing basin (Figure 2). Most of the area is covered with alluvium except for a thin veneer of Cretaceous and Tertiary shelf sediments skirting Mikir Hills and Shillong Plateau. It extends westward beyond Bangladesh and West Bengal up to Orissa, including part of Burma in the east and south. The shelf consists of Shillong Plateau, Mikir Hills, the Garo, Khasi, Jaintia Hills and the Upper Assam Valley. Geologically, this is the northeastern prolongation of the Indian Peninsular Shield with Garo -Rajmahal traps in between (Murty, 1983). Metamorphics of Mishmi Hills of Arunachal Pradesh occur towards the northeast of the shelf. Hill ranges of Nagaland, Cachar, and Mizoram belonging to the mobile belt mark the southern and southeastern edge of the shelf. To the north, the Himalayan Foredeep, exposing Siwalik molasse, bound the shelf sediments. The Shillong Plateau and Mikir Hills, with relatively undisturbed cover of Cretaceous-Tertiary sediments, form the western and southwestern extension. The Assam Shelf has been further subdivided into two parts: North Assam/Upper Assam Shelf and South Assam Shelf by Jorhat fault. Present study area is the entire North Assam/Upper Assam Shelf (Figure 2).
Stratigraphic succession of Assam Shelf has been widely discussed by Evans (1932), Mathur and Evans (1964), Dasgupta (1977), and Deshpande et al. (1993). Regionally, Assam Shelf exhibits a “Weimerian layer cake” (Weimer et al., 1965) stratigraphy typical of epicontinental basins overlying the Precambrian granite basement. Up to this time, more than 1200 wells have been drilled on Upper Assam Shelf, and subsurface sedimentary records have been confirmed from Paleocene to Recent in age with a major break in sedimentation during Oligocene, late Miocene, and Pliocene times. The standardized lithostratigraphic succession (Deshpande et. al., 1993) for Assam Shelf, shown in Figure 3, depicts the generalized stratigraphy of Upper Assam.
In Assam Shelf area, the Paleogene sediments are mostly deposited in shallow marine to transitional environments. Thickness of these sediments increases from northwest to southeast, suggesting the basinal system towards the southeast (Bhandari et al., 1973; Murty, 1983). The end of Paleogene is marked by the widespread well recognized Oligocene unconformity.
Tertiary rocks rest directly over the granite gneiss and are divisible into two supergroups (Bhandari et al., 1973). The older Naga Supergroup of Paleogene age is further divided into Jaintia and Barail groups.
Jaintia Group (Paleocene- Eocene) is composed of:
The primary objectives of this study were:
In the present study concerted efforts have been made,
based on sequence stratigraphic approach, to collate well logs,
Well Log Profiles
Forty-five deep wells in the area have been studied, and 6 regional electrolog profiles (Figure 4; showing 3 dip and 3 strike profiles) were prepared for 22 wells; in most of them the entire Kopili sections are represented.
Thickness Distribution Trends
Overall, Kopili isochronopach map suggests four thickness maxima (Figure 5a and b). Three thickness maxima are Amguri, Charli-Rudrasagar, and Geleki-Nazira low areas. Another maximum is indicated towards the northwest and northeast of Lakwa area. The isochronopach map shows gradual thinning in the updip direction and thickening in downdip direction. The thickness of Kopili Formation indicates a gentle slope towards northeast, whereas towards south and southeast directions the dip is quite steep at places, as shown in Figure 5. The areas shown as red has thinner Kopili sediments indicative of paleohighs. Areas shown as yellow received more sediments and green shows maximum Kopili thickness, suggesting paleoslope in southeast and northeast directions (Figure 5b).
Reflection configuration of Kopili Formation
The deposits of sand/shale alternations that broadly
constitute a major part of the Kopili Formation overlie the Sylhet Formation
. Seismically the Kopili sequence is mostly transparent with low amplitude,
moderate frequency, discontinuous to patchy reflections. The high amplitude
Application of Sequence Stratigraphy vs. Lithostratigraphy
The lithostratigraphic analysis provides only descriptive information of lithologic distribution, which in some instances could combine the products of sedimentation of various depositional environments. Simple maps of lithologic distribution give little insight as to the general paleogeography and, as a result, are of little use in predicting lithologies away from known data points. On the other hand, sequence stratigraphic correlations depend on interpretation to develop the correlation model. Therefore, sequence stratigraphy has an important built-in interpretation component, which addresses issues such as the reconstruction of the allogenic controls at the time of sedimentation and predictions of facies architecture in yet unexplored areas (Catuneanu et al., 2005).
Figure 6 shows the inherent difference between lithostratigraphy and sequence stratigraphy; both analyze the same sedimentary succession but with the focus on different stratigraphic aspects, or rock properties. Lithostratigraphy deals with the lithology of strata and with their organization into units based on lithological character.The boundaries between lithostratigraphic units are often highly diachronous facies contacts, in which case they develop within the sedimentary packages bounded by sequence stratigraphic surfaces. Sequence stratigraphy deals with the correlation of coeval stratal units, irrespective of the lateral changes of facies that commonly occur across a basin and which are bounded by low diachroneity (i.e., nearly synchronous) surfaces. It is also important to note that facies analyses leading to the interpretation of paleoenvironments are much more critical for sequence stratigraphy than for lithostratigraphy. Understanding what constitutes a reasonable vertical and lateral relationship between facies within a time framework assists in correlating the same time lines through varying lithologies. Thus, the concepts of sequence stratigraphy may ultimately provide the framework that will allow previously defined types of stratigraphic units and surfaces to obtain a clear status in relation to each other and within the bigger picture of genetic stratigraphy. The present study has dealt with the sequence stratigraphy of Kopili Formation in a detailed manner.
Van Wagoner (1990) performed sequence stratigraphic analysis using wireline logs. A well log sequence is a depositional sequence identified on a well-log cross section. Multi-well studies using a suite of wireline logs provide invaluable information to sequence analysis and help in developing an architectural and space-time reconstruction of the formation. As the imaging for Kopili Formation is not always conspicuous, this study could be firmed up in conjunction with the well-log analysis, biostratigraphic studies, and paleobathymetric data and finally integrated to define various depositional sequences, which are subsequently mapped to bring out regional depositional pattern of the entire area.
Palynological marine index (PMI) has been calculated for a few wells. PMI helps in the recognition of sequence boundaries and maximum flooding surfaces (Figure 7). Normally, sequence boundaries can be found in the intervals with upward-decreasing values of PMI, whereas maximum flooding surfaces usually will be near the maximum values of PMI in each sequence. PMI values, when calibrated with the well data, indicate good match and, therefore, provide an excellent support of the sequence stratigraphic analysis. The characteristic dinoflagellate cysts include: Polysphaeridium congregatum, Achomosphaera sp., Spiniferites sp., Cleistosphaeridium sp., and Diphyes colligerum. A few age marker species recognized in Kopili Formation are: Muratodinium fimbriatum (44 Ma), Apectodinium homomorphum (41 Ma), Adnatosphaeridium multispinosum (39.5 Ma), and Glaphyrocysta exuberans (38 Ma). The percentage ratio of dinocysts and pollen spore has been used to interpret the depositional environment. (Rawat et.al., 1999)
Biostratigraphically, Kopili is characterized by the presence of calcareous foraminifera. The overall faunal frequency and the size of the forams decrease towards the upper part. A few arenaceous forams, like Trochammina and Haplophragmoides (normal growth), are also seen. The diminutive calcareous forms and the presence of the above arenaceous forams suggest the possible deposition in estuarine conditions, with salinity ranging from 100-20,000 ppm. (Mohan and Pandey, 1973).
Sequence Straigraphic Analysis
Three higher order sequences have been identified within
Kopili Formation. Sequence boundaries and maximum flooding surfaces have been
determined from the biostratigraphy and subsequently integrated with the well
logs and the paleobathymetry data. However, the identified sequences are not
distinguishable in
It is the lowermost sequence identified within Kopili
Formation. As the
As stated earlier, sequence top identified on logs is not
resolved in
Sedimentary thickness of this, the middle, sequence is less than that of the other two sequences. Thickness is more or less uniform. Two types of system tracts (HST and TST) are present within this sequence. HST of this sequence has been mapped and the analysis of the map is presented below:
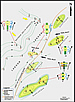
Sand thickness ranges from 10m in #L to 33m in #A. In Amguri area thickness varies from 22-33m and from 14-27m in Charali-Demulgaon-Kuargaon area. In Lakwa-Moran-Sonari area thickness of sand ranges between 14-20m, whereas in Rudrasagar-North Rudrasagar-Rajmai area sand thickness is between 10-18m. In Panidihing, sand thickness is in the range of 10-26m. Again in Dikhowmukh-Disangmukh area comparatively greater thickness of sand (22-29m) is observed. Sands are found to be distributed as elongate, discrete bodies particularly in Amguri-Geleki area, Charali-Demulgaon-Kuargaon area, and Lakwa-Moran-Sonari area along a linear trend (Figure 14). These elongate bodies strike NE-SW, the direction which is also parallel to the strike of the basin. Based on log motif, dipmeter data, and available sedimentological data, those bodies are interpreted as barrier bars that thicken towards SE. Sand geometry is indicative of bayhead deltaic setting environment.
As the
This is the uppermost sequence of three identified sequences. The thickness of it is greater than that of the other two sequences. Gradually the thickness increases towards the southeast of the study area. Two types of system tracts (HST and TST) are present within this sequence. A map has been prepared for the HST to show the distribution pattern of sands within this sequence (Figure 16). Based on the sand distribution pattern, it is interpreted that in Geleki, Amguri, Charali, Lakwa, Moran and Sonari areas sands have been deposited as offshore bars. Towards the southwest and northwest, the depositional environment graded to lagoon. Farther towards the west the depositional setting changed to a bayhead delta.
The reflector ranges from 2600 msec in Disangmukh area to
5100 msec in Sonari–Nazira low area. It is discontinuous and patchy in the
whole area. TWT relief (structure) map with
Kopili Formation is primarily an argillaceous section with some isolated, scattered, discrete sands distributed on the entire North Assam Shelf. Sand thickness is found to be on the order of 8-30m. The depth of occurrence makes it difficult to resolve its heterogeneity and spatial geometry with confidence. Delineation of these individual sands within the formation is difficult due to the following reasons:
To identify the prospective areas, locales of sand maxima coupled with structural advantageous positions have been our main interest. To achieve this objective, the sand thickness trends were calculated from logs and a reasonable horizon window was calculated to accommodate most of the sands from the Kopili package to avoid tuning constraints. Accordingly, a window of 100 msec above Sequence II top was taken for generating attribute maps.
Instantaneous frequency and amplitude attributes were extracted, and spectral decomposition technique was also attempted. Several discrete sand geometries are observed in the area. Kopili sands could be recognized by the moderate to high amplitude and low to moderate frequency anomalies in the above-mentioned attributes. Low to moderate frequencies have been identified to be the anomalous pattern corresponding to the sands within thick shales of Kopili Formation (Figure 18).
As there is hardly any core data available for the Kopili
section for the entire North Assam Shelf, depositional environment has been
estimated on the basis of sequence stratigraphic analysis. Log data have been
integrated with the
It is basically a shoreline strike system, sediments transported by longshore currents. In Upper Assam Shelf a linear NE-SW trend of Amguri-Geleki-Charali-Lakwa–Moran consists of the elongate, discrete offshore bars. Relative lowering of sea level or increase in rate of sediment supply causes depositional regression (Curray, 1964) or normal regression (Posamentier, 1992) .Net effect was the seaward accretion of littoral sediments which were subsequently redistributed by longshore currents and deposited as offshore bar sands. These sand bodies grade landward into lagoonal muds and basinward into shelf muds and act as a barrier between estuary and the open sea. Towards the west of the mapped area (Figures 12, 14 , and 16) lay a lagoonal environment.
Tidal Inlet-Tidal Bar System
Intermittently, along its length the barrier bars were cut by tidal channels, or tidal inlets. Two such tidal inlets are observed between Charali and Lakwa bars and Lakwa and Moran bars. Area around wells R-134, R-156 and D-31was influenced by tidal bar deposits. Landward, towards the west, lagoonal conditions prevailed.
Bayhead Delta
Area farther west; i.e., the whole stretch from Dikhowmukh in the southwest to Panidihing in northwest, was under the influence of bayhead delta environment. A shore-parallel sand geometry marks the imprint of bayhead delta deposits.
Overall Pattern
Based on the above analysis, one composite sand geometry map has been prepared for the entire Kopili Formation of the North Assam Shelf to demonstrate the environmental setting during deposition of Kopili Formation (Figure 19). Different subenvironments and sediment input direction are clearly shown in this map Therefore, it can be concluded that Kopili Formation was deposited in a shallow-marine nearshore to coastal-transitional setting under medium to low hydrodynamic energy conditions. In general, the faunal, floral, and sedimentological data (including granulometric studies) infer that the Lower Kopili sediments were deposited in shallow, inner shelf conditions while the Upper Kopili was deposited in a marginal marine to transitional setting (Goswami et.al., 2000). Overall, the depositional setting of Kopili Formation can be compared to a typical estuarine-embayment type of deposition. The diagram shown in the Figure 20 seems to be analogous to the strata of our study area.
Hydrocarbon Prospectivity Analysis
Geleki field is the only established commercial
hydrocarbon producer from the sands of Kopili Formation in the entire Upper
Assam Shelf. A very few wells have produced significant amounts of liquid
hydrocarbon from Koplil sands. In Lakwa, a few deep wells have reported
hydrocarbon shows during drilling, and Kopili sands are also interpreted as hydrocarbon-bearing
in logs of a few such wells. Apart from these two areas Kopili sands did not
show encouraging results. West of Geleki-Lakwa trend, sands are found to be
water-bearing. It appears that structures closest to the kitchen (farther
southeast of Geleki-Lakwa trend) were charged and the structures farthest
from the kitchen were not charged. System tract analysis has shown good
development of offshore bars towards the eastern and southeasterns part of
the entire area. These offshore bars lie in close proximity to the kitchen
area and also have good structural advantage. Keeping this view in mind we
have analyzed the prospectivity of Kopili Formation in the Upper Assam Shelf.
This is likely to open good
With the established leads from the Kopili play in Geleki and Lakwa areas this study has incorporated enhanced quality 3D data (PSTM/PSDM) inputs along with the G&G data within sequence stratigraphic framework to arrive at the following conclusions:
Bhandari, L.L., Fuloria, R.C., and Sastry, V.V., 1973, Stratigraphy of Assam valley, India, AAPG Bulletin, v. 57, p. 642-656.
Catuneanu, O., 2005, Principles of Sequence Stratigraphy: Elsevier Science Ltd., Amsterdam
Curray, J.R., 1964, Transgressions and regressions, in Miller, R.L., ed., Papers in Marine Geology: New York, Macmillan, p. 175-203.
Dalrymple, R. W., B.A. Zaitlin, and R. Boyd, 1992, Estuarine facies models--Conceptual basis and stratigraphic implications: Journal of Sedimentary Petrology, v. 62/6, p. 1130-1146
Das Gupta, A.B., 1977, Geology of Assam– Arakan region, Oil Commentary, India: v. 15, p. 4 –34
Deshpande, S.V., et. al., 1993, Lithostratigraphy of Indian petroliferous basins, Assam-Arakan basin, v. I, II document X: KDMIPE, ONGC.
Evans P., 1932, Tertiary succession in Assam: Trans. Min. Geol. Inst, India, v.27, p.155.
Goswami, P., and Dutta, A.J., 2000, Depositional environment, reservoir characteristics and source rock potential of Kopili Formation, Geleki Field: unpublished ONGC report.
Mathur, L.P., and and Evans P., 1964,Oil in India: 2nd International Geological Congress, New Delhi, India, p. 85.
Mohan, M., and Pandey, J.,1973, Early Paleogne eco-stratigraphy of Upper Assam: Bulletin Indian Geological Association, v.6, no.1, p.47-62.
Murty, K.N., 1983, Geology and hydrocarbon prospects of Assam Shelf--Recent advances and present status: Petroleum Asia Journal, v. 1, p.1-14.
Naik, G.C., et al., 2001, Sequence stratigraphy and petroleum systems of Assam Shelf: unpublished report, BSD, KDMIPE, ONGC.
Posamentier, H.W., Allen,
G.P., James, D.P., and Tesson, M., 1992, Forced regressions in a sequence
stratigraphic framework: Concepts, examples, and
Rawat, R.S., Pundeer, B.S., and Phor, L., 1999, Sequence stratigraphy and petroleum systems in Assam Shelf (Palynological part): unpublished ONGC report.
Reinson, G.E., 1992, Transgressive barrier-island and estuarine systems, in: R.G. Walker and N.P. James (eds.). Facies Models: Response to Sea Level Change: Geological Association of Canada, p. 179-194.
Shanmugam, G., Poffenberger, M., and Alava, J.T., 2000, Tide-dominated estuarine facies in the Hollin and Napo (“T” and “U”) formations (Cretaceous), Sacha Field, Oriente Basin, Ecuador: AAPG Bulletin, v. 84, no. 5, p. 652-682.
Van Wagoner, J.C., Mitchum, J.C., Campion, K.M., and Rahmanian,
V.D., 1990, Siliciclastic sequence stratigraphy in well logs, core and
outcrop concepts for high-resolution correlation of time and facies:
AAPG.Methods in
Weimer, R.J., 1965, Late Cretaceous deltas, Rocky Mountain Region (abstract): AAPG Bulletin, v. 49, p. 363.
Zaitlin, B.A., 1994, The
Stratigraphic Organization of Incised Valley Systems: Implications to
Hydrocarbon
The authors are highly indebted to ONGC Limited for giving
an opportunity to work on this topic Authors express their deep gratitude to
D. K. Pande, Director (
|