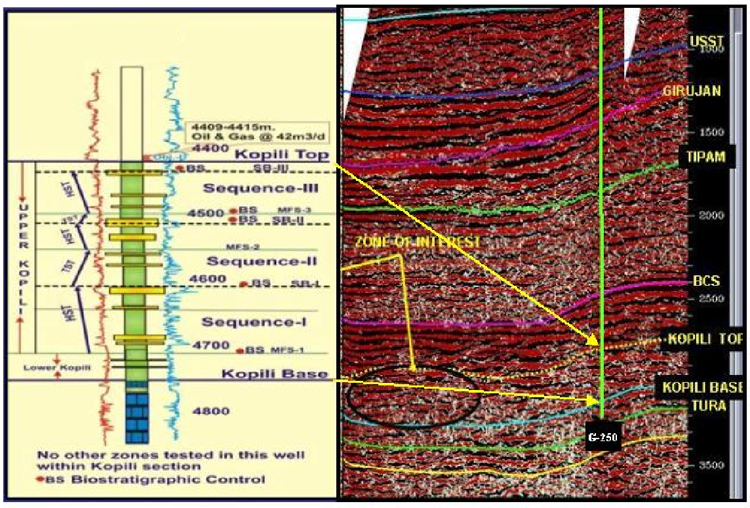
Figure 8. Type log, along with seismic response, showing sequence stratigraphic analysis in well G#250 depicting identified sequence boundary, maxiumum flooding surfaces, and system tracts.
Figure 8. Type log, along with seismic response, showing sequence stratigraphic analysis in well G#250 depicting identified sequence boundary, maxiumum flooding surfaces, and system tracts.