![]() Click to view article in PDF
format.
Click to view article in PDF
format.
East Java Mud Volcano (LUSI): Drilling Facts and Analysis*
Nurrochmat Sawolo1, Edi Sutriono1, Bambang P. Istadi1, and Agung B. Darmoyo1
Search and Discovery Article #50186 (2009)
Posted June 10, 2009
*Adapted from extended abstract prepared for AAPG International Conference and Exhibition, Cape Town, Africa, October 26-29, 2008. Another article on this subject, with a different interpretation, is “Triggering of the Lusi Mud Eruption: Earthquake Versus Drilling Initiation,” by Mark Tingay et al., 2008, Search and Discovery Article #50187 (2009).
1Energi Mega Persada, JI. Jend. Gatot Subroto 42, 12710, Jakarta Indonesia
A sudden eruption of hot mud and steam began on May 29th, 2006, near the Banjarpanji-1 exploration well in Sidoarjo, East Java, Indonesia. In the early stages, the general public opinion speculated that the mud flows were caused by an underground blowout on the Banjarpanji well. But as the data was studied and analyzed, it quickly became clear that the mud flow was not triggered by the well, that an underground blowout did not occur. Firstly, the well-bore fluid pressure was too low to fracture the well bore. Secondly, there was no sustained pressure to propagate fractures. Thirdly and most importantly, the well bore was open and totally dead whilst mud was erupting at more than 300,000 bbl/day only 200 m away.
In the absence of the Underground Blowout, studies (e.g., Mazzini et al., 2007) suggest that tectonically reactivated faults provide the conduit for the water and overpressured shale to erupt and form the LUSI mud volcano. The presence of overpressured zone due to rapid subsidence and burial in the East Java Basin is evident. The high sedimentation rate of its maturing organic-rich sediments makes it an ideal setting for mud volcanism. Other mud volcanoes occur naturally in the area, and they are aligned with the LUSI mud volcano on the NNE-SSW Watukosek fault zone.
|
On May 29, 2006, at around 05:00 hrs it was reported that Hot Water eruption intermittently with a maximum height of 25 ft and elapsed time of 5 minutes between the burst occurred around 200 meters from the well. This burst was very dramatic with a distinct geyser-like cycle of active and passive periods. This marks the formation of a new mud volcano known as LUSI in East Java, Indonesia. This new mud volcano adds to the many mud volcanoes existing in the area, such as the Porong collapse structure (NE of LUSI), Kalang Anyar & Pulungan (Sedati, Sidoarjo), Gunung Anyar (UPN campus, Surabaya), Bleduk Kuwu & Keradenan (Purwodadi), Wringin Anom / Pengangson (Gresik), Semolowaru (Unitomo campus, Surabaya), Dawar Blandong (Mojokerto), Sangiran (Central Java), Socah (Bangkalan, Madura) and others. LUSI however is special, as one can observe the ongoing geological processes from its controversial birth.
Three different hypotheses have been proposed as the trigger of LUSI; namely: i). Underground Blowout (Davies et al., 2007; Tingay et al., 2008). ii). Mud Volcanism due to remobilization of overpressured shale through a reactivated fault as the conduit (Mazzini et al., 2007). iii). Geothermal activities where superheated hydrothermal fluids at high temperature and pressure are released through fault zone or fracture network as the conduit.
The objective of this paper is to clearly and transparently set out the drilling engineering data and analysis to correct the technical record and to provide a platform for further analysis. It focuses on key drilling pressure measurements and drilling facts to investigate the early speculation that drilling was the trigger of LUSI.
Underground Blowout As a Hypothesis
Several writers suggested that an Underground blowout triggered LUSI (Davies et.al, 2007; Tingay et al., 2008). However, the facts and pressure calculations clearly show that an underground blowout did not happen in the Banjarpanji-1 well. Several conditions must be met for an underground blowout to occur. The most important is that pressure in the wellbore must be sufficiently high to break the weakest formation (typically the casing shoe). Secondly, sustained fracture propagation pressure is required to extend the fracture to surface. Davies et al. (2007) suggested that the casing shoe was fractured and breached. However, calculations based on proper data obtained from the well and related facts clearly show the opposite; the shoe was still intact and not breached.
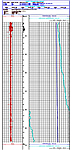
An investigation was carried out to determine if there was a connection between the well and the mud eruption. If an underground blowout did occur, then it was expected that a temperature anomaly and noise would be recorded in the Banjarpanji-1 wellbore. Temperature and Sonan logging were carried out during the relief well campaign to determine if such phenomena occurred. The temperature logs did not record any anomaly within the Banjarpanji-1 well (Figure 1). The sonan log did not indicate any unusual noise, indicating there was no flow behind casing (Figure 2).
Other facts that do not support the underground blowout hypothesis include:
Banjarpanji-1 Casing Shoe Strength Analysis
The following data is used to calculate the pressure at the casing shoe and determine if an underground blowout occurred in the well.
The maximum Casing Pressure of 1,054 psi is used based on the Real Time Data (RTD) of May 28th, 2006. This casing pressure of 1,054 psi is considered as more reliable pressure measurement where stabilized maximum pressure is reached 36 minutes after shut in, and remained constant until it was bled off as part of the well control procedure, as shown in Figure 5.
Note that the normal reading of ISICP (Initial Shut In Casing Pressure) is not applicable here since the casing pressure was not stable throughout the shut in period. Similarly the drill pipe pressure cannot be used to calculate well pressure in this instance because of a flapper valve at the bottom of the drill string that prevented wellbore pressure reading.
Fluid Density at the Top of the Well
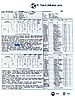
The well took a fluid influx of over 300 bbls. During the kill process, the well was bled off and found water instead of gas or mud. After the well was killed, this influx was circulated out with a density of 8.9 ppg as shown in the well’s IADC report and Morning Report dated May 29, 2006 (Figure 6). The influx represents approximately 30% of the hole volume. This large influx of water, due to its lighter density found its way to the top and occupied the upper portion of the well.
The bottom hole pressure is calculated to be 12.8 ppg based on the fill-up volume of the well (Real Time Data of May 27, 2006). The common practice for calculating bottom hole pressure when a loss circulation occurs is by measuring the amount of mud needed to fill the hole (Fill Up method). It took 220 bbl to fill-up the hole, equivalent to 6200 psi (12.8 ppg) of bottom hole pressure (Figure 7).
This calculated BHP value of 12.8 ppg was checked using other theoretical bottom hole pressure calculations using the drilling Dc-exponent and Resistivity log which shows that the value is within the correct range (Figure 8). Other evidence that supports the correctness of this Bottom Hole Pressure includes:
The leak off test done at the 13 3/8” casing shoe is shown in Figure 9. The LOT was 16.4 ppg at a depth of 3580 ft. The LOT result is consistent with the LOT of Wunut 2, an offset well approximately 2 km away which had a LOT of 16.6 ppg at a shallower depth of 3160 ft. It should be noted that the shallow section of Banjarpanji-1 is within the Wunut anticlinal structure.
Pressure Analysis at the Casing Shoe
This analysis showed that it is intact.
Using the basic data above, the pressure analysis is as follows: 1. Maximum Casing Pressure = 1,054 psi. 2. Fluid in the upper part of the hole = 8.9 ppg. Maximum mud weight = 14.7 ppg. 3. Bottom Hole Pressure = 12.8 ppg. 4. Leak Off Test at the casing shoe (3,580’) = 16.4 ppg.
The resulting graph is shown in Figure 10. The pressure at the shoe exerted by the fluid is 2710 psi which is lower than the strength of the rock (LOT) of 3053 psi. This proves that the weakest point in the well, which is the shoe, was still intact and was not fractured.
Observers were quick to assume that the mud eruption was caused by an Underground Blowout because of its proximity to the well. Arguments on Underground Blowout, however, are not supported by facts.
These include: 1. Davies et al. (2007) showed the bottom hole pressure of 48 MPa (14.4 ppg) and proposed a kick occurred while drilling into the Kujung Formation. However, in fact well had a loss, not a kick, when drilling using 14.7 ppg drilling mud on May 27, 2006. The well suffered a partial loss of 20 bbls of drilling mud less than 10 minutes after May 27, 2006, earthquake recorded at the Tretes BMG Station (Figure 11). The total loss of circulation of 130 bbls occurred in the well after 2 major aftershocks around midday of the same day. 2. Tingay et al. (2008) quoted pore pressures which are unrealistically high (Figure 3). Pore pressure in BJP-1 was reported as 17.84 MPa/km (15.2 ppg) at 2130 m depth and 17.1 MPa/km (14.5 ppg) at 2800 m depth. These pressures are higher than the mud weight and the Static Influx Test that shows the actual pore pressure to be much lower than 14.7 ppg. 3. Claims made by Davies et al. (2007) that hydrofracturing occurred and by Tingay et al. (2008) that the fluid pressures inside the well exceeded 19.5 MPa/km (16.4 ppg) shortly after the blowout preventer was closed. Contrary to claims, as shown on Figure 10 and by calculations below, the pressure at the casing shoe, which is the weakest point of the wellbore, was lower than the fracture pressure. Pressure at casing shoe = Maximum casing pressure + hydrostatic pressure of fluid P@3580 = 1054 + (0.052 x 8.9 x 3580) = 2710 psi < 3053 psi (fracture pressure)
A number of papers hypothesized that the birth of the LUSI mud volcano was related to drilling of the Banjarpanji-1 well.
This article presents drilling data, facts, analysis, and investigation during the re-entry and relief well campaign, which show that the well casing shoe did not breach. The well bore pressure was too low to fracture the well. Supporting this conclusion, field data demonstrated that the well was still intact and indicated no communication between the well and the mud eruption. Therefore it is concluded that an Underground Blowout as a trigger of the LUSI mud volcano is a hypothesis not supported by drilling data and facts.
In the absence of any evidence supporting an underground blow out hypothesis, reactivation of the Watukosek Fault is seen as the most likely and natural trigger for the mud volcano, as there was a clear connection between the timing of earthquake and after-shocks, and mud losses in the well.
Davies, R.J., R.E. Swarbrick, R.J. Evans, M. Huuse, 2007, Birth of a mud volcano, east Java, 29 May 2006: GSA Today, v. 17/2, p. 4-9. http://dx.doi.org/10.1130/GSAT01702A.1
Mazzini, A., H. Svensen, G.G. Akhmanov, G. Aloisi, S. Plante, A. Malthe-Sorenssen, and B. Istadi, 2007, Triggering and dynamic evolution of the LUSI mud volcano, Indonesia: Earth and Planetary Science Letters, v. 261/3-4, p. 375-388. http://dx.doi.org/10.1016/j.epsl.2007.07.001
Tingay, M., O. Heidbach, R. Davies, and R. Swarbrick, 2008, Triggering of the Lusi mud eruption; earthquake versus drilling initiation: Geology Boulder, v. 36/8, p. 639-642. http://dx.doi.org/10.1130/G24697A.1
Tingay, M., O. Heidbach, R. Davies, and R. Swarbrick, 2008, The Lusi mud eruption of East Java (abstract): Search and Discovery Article #90082 (2009) http://searchanddiscovery.net/abstracts/html/2008/intl_capetown/abstracts/469863.htm
|