Click to
view article in PDF format.
Click to
view article in PDF format.
GCMapping Geologic Features Using Seismic Curvature*
By
Satinder Chopra1 and Kurt J. Marfurt2
Search and Discovery Article #40272 (2008)
Posted February 7, 2008
*Adapted from the Geophysical Corner column, prepared by the authors, in AAPG Explorer, November, 2007, Part 1, entitled “Using Curvature to Map Faults, Fractures”, and December, 2007, Part 2, entitled “Curvature Can Be a Map to Clarity”. Editor of Geophysical Corner is Bob A. Hardage ([email protected]). Managing Editor of AAPG Explorer is Vern Stefanic; Larry Nation is Communications Director.
1Arcis Corporation, Calgary, Canada ([email protected])
2University of Oklahoma ([email protected])
General Statement
Curvature is a measure of the deviation of a surface from a plane. The more a surface is structurally flexed, folded or faulted, the larger its curvature. Curvature can indicate domes and sags associated with salt and shale diapirism, differential compaction, and diagenetic dissolution and collapse, as well as predict paleostress and areas favorable for natural fractures.
Curvature is usually computed from picked horizon surfaces interpreted on 3-D seismic data volumes. An interpreter defines surface patches of a given size, which appropriate software algorithms then fit with a mathematical quadratic surface. Curvature measures computed from the coefficients of this quadratic surface include:
1) Curvedness.
2) Azimuth of minimum curvature.
3) Shape index.
4) Minimum, maximum, most-positive, most-negative.
5) Dip.
6) Strike curvatures.
We find the most-positive and most-negative curvatures to be the easiest measure to visually correlate to features of geologic interest.
|
uFigure CaptionsuMethoduFaults and Fractures
uFigure CaptionsuMethoduFaults and Fractures
uFigure CaptionsuMethoduFaults and Fractures
uFigure CaptionsuMethoduFaults and Fractures
uFigure CaptionsuMethoduFaults and Fractures
uFigure CaptionsuMethoduFaults and Fractures
|
Method
Figure 1a shows a
Whether due to limitations in the survey design, coherent noise, or systematic errors in data processing, an acquisition footprint is related to the source and receiver geometry and has little correlation to the subsurface geology. Horizons picked on noisy seismic data contaminated with acquisition footprint, or picked through regions where no consistent impedance contrast exists (such as channels, turbidites, mass transport complexes, and karst), can lead to inferior curvature measures. A significant advance in curvature analysis has been the volumetric estimation of curvature, which alleviates the need for picking horizons in regions where no continuous surface exists. Even when spatial filtering is used to minimize effects of an acquisition footprint, horizon-based curvature estimates may still suffer from footprint artifacts. In contrast, curvature attribute values extracted from volumetric curvature computations yield displays that are free of artifacts and make more geologic sense.
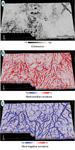
Faults and FracturesAs examples, Figures 1d and 1e show the most-positive and most-negative volumetric curvature attributes extracted along the horizon surface in Figure 1a. Notice that these displays are free of the N-S and E-W artifacts seen in Figures 1b and 1c, and show arcuate folds indicated by yellow arrows. The advantages of volumetric attributes are two-fold: 1) As shown in Figure 1, the images have a higher signal-to-noise ratio. Volumetric estimates of curvature are computed not from one picked data sample, but rather from a vertical window of seismic samples (in our case, 11 samples) and are statistically less sensitive to noise. 2) Not every geologic feature that we wish to interpret falls along a horizon that can be interpreted. Often the target of interest falls above or below a strong, easily picked horizon.
Curvature images having different spatial wavelengths provide different perspectives of the same geology. Tight (short-wavelength) curvature delineates small details, such as intense, highly localized fracture systems. Broad (long-wavelength) curvature enhances smooth, subtle flexures that are difficult to see in conventional seismic data, but which are often correlated to fracture zones that are below seismic resolution and to collapse features and diagenetic alterations.
Figure 2 shows displays of strat-cubes
near 1620 ms from coherence, most-positive (both long-wavelength and
short-wavelength) and from short-wavelength, most-negative curvature
volumes that intersect a random line that cuts across the
fault/fracture trends. The red peaks (Figures
2b and 2c) on the fault lineaments (running almost north-south)
correlate with the upthrown signature on the seismic data. The
most-negative curvature strat-
Figure 3a
shows the horizon
|