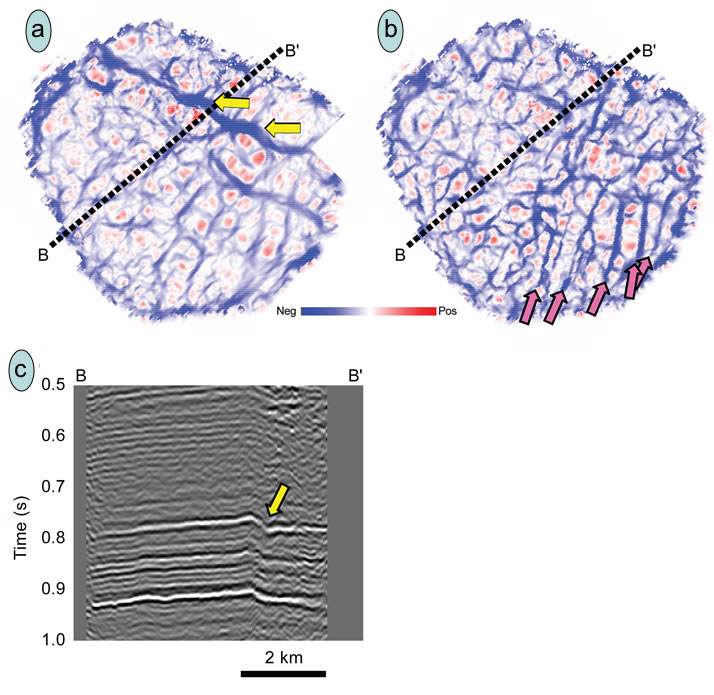
Figure 6. Time slices at (a) t = 0.80 s (approximate Trenton) and (b) t = 0.94 (approximate basement) through the most-negative curvature volume computed from a survey acquired over Saybrook Field, northeastern Ohio. (c) Vertical slice through the seismic data. Yellow arrows indicate hydrothermally altered dolomite zones. Magenta arrows indicate faults in the basement.