--> Use of High-Resolution Core Description Data to Risk Net Pay from Log-Based Petrofacies for Thinly Bedded Deepwater Channel Complexes, Zafiro Field, Equatorial Guinea, by T.C. Lukas and P. Schwans, #40248.
[First Hit]

Datapages, Inc.Print this page

Click to view poster in PDF format (~6.6 mb).   


PSUse of High-Resolution Core Description Data to Risk Net Pay from Log-Based Petrofacies for Thinly Bedded Deepwater Channel Complexes, Zafiro Field, Equatorial Guinea

By

T.C. Lukas1 and P. Schwans2


Search and Discovery Article #40248

Posted July 30, 2007


*Adapted from poster presentation at AAPG Annual Convention, Long Beach, California, April 1-4, 2007


1Consultant, Houston, TX ( [email protected] )

2Devon Energy, Houston, TX ( [email protected] )


Abstract 

Log-based facies or petrofacies contain thin beds at or below log-resolution. Individual beds range from 2 – 0.01 feet. As a result of thickness variations and stacking densities, estimates of thin bed net pay are associated with significant uncertainty. Cores from Zafiro Field, Equatorial Guinea, were used to define thin-bed types and the ranges of uncertainties associated with the beds identified via logs and cores. 

The Zafiro Field of Equatorial Guinea comprises a series of stacked channel complexes of Miocene-Pliocene age deposited in the mid to lower slope position of the Niger Delta. Thin bed environments in channel complexes include crevasse splays, avulsion related lobes, lobes associated with overbank channels, levees, and indeterminate remnants of near-channel overbank. High-resolution core description data (100 samples/ft) from proximal to distal overbank deposits were compared to log-based petrofacies computations. Data from the two methods were compared as a function of hydrocarbon saturation, bed thickness, lithology, and grain size and used to condition the computations. This was compared to the pay computed and predicted from the petrofacies probability curves. A set of confidence levels are applied to a range of So cutoffs to better define the uncertainty range. The described approach allows better benchmarking and risking of log-based thin bed calculations and can be used in Previous HitgeostaticTop models.


uAbstract

uQ & A / goals

uPetrofacies probabilities

uZafiro-3 vs Opalo-2

  uFigures 11-14

  uZafiro-3

  uOpalo-2

uPrediction

  uFigures 15-17

uApplication

  uSerpentina West

  uTopacio South 2

uFacies & petrophysical modeling

  uFigures 25-33


uAbstract

uQ & A / goals

uPetrofacies probabilities

uZafiro-3 vs Opalo-2

  uFigures 11-14

  uZafiro-3

  uOpalo-2

uPrediction

  uFigures 15-17

uApplication

  uSerpentina West

  uTopacio South 2

uFacies & petrophysical modeling

  uFigures 25-33


uAbstract

uQ & A / goals

uPetrofacies probabilities

uZafiro-3 vs Opalo-2

  uFigures 11-14

  uZafiro-3

  uOpalo-2

uPrediction

  uFigures 15-17

uApplication

  uSerpentina West

  uTopacio South 2

uFacies & petrophysical modeling

  uFigures 25-33


uAbstract

uQ & A / goals

uPetrofacies probabilities

uZafiro-3 vs Opalo-2

  uFigures 11-14

  uZafiro-3

  uOpalo-2

uPrediction

  uFigures 15-17

uApplication

  uSerpentina West

  uTopacio South 2

uFacies & petrophysical modeling

  uFigures 25-33


uAbstract

uQ & A / goals

uPetrofacies probabilities

uZafiro-3 vs Opalo-2

  uFigures 11-14

  uZafiro-3

  uOpalo-2

uPrediction

  uFigures 15-17

uApplication

  uSerpentina West

  uTopacio South 2

uFacies & petrophysical modeling

  uFigures 25-33


uAbstract

uQ & A / goals

uPetrofacies probabilities

uZafiro-3 vs Opalo-2

  uFigures 11-14

  uZafiro-3

  uOpalo-2

uPrediction

  uFigures 15-17

uApplication

  uSerpentina West

  uTopacio South 2

uFacies & petrophysical modeling

  uFigures 25-33


uAbstract

uQ & A / goals

uPetrofacies probabilities

uZafiro-3 vs Opalo-2

  uFigures 11-14

  uZafiro-3

  uOpalo-2

uPrediction

  uFigures 15-17

uApplication

  uSerpentina West

  uTopacio South 2

uFacies & petrophysical modeling

  uFigures 25-33


uAbstract

uQ & A / goals

uPetrofacies probabilities

uZafiro-3 vs Opalo-2

  uFigures 11-14

  uZafiro-3

  uOpalo-2

uPrediction

  uFigures 15-17

uApplication

  uSerpentina West

  uTopacio South 2

uFacies & petrophysical modeling

  uFigures 25-33


uAbstract

uQ & A / goals

uPetrofacies probabilities

uZafiro-3 vs Opalo-2

  uFigures 11-14

  uZafiro-3

  uOpalo-2

uPrediction

  uFigures 15-17

uApplication

  uSerpentina West

  uTopacio South 2

uFacies & petrophysical modeling

  uFigures 25-33


Basic Q & A, Data Analysis, and Data Products

(Figures 1-3) 

Figure 1. Thin beds from well logs.

Figure 2. Data analysis.

Figure 3. Data products.


Goals, Evaluation, Description, and Comparison

(Figures 4-10)

Figure 4. Apply core description techniques.

Figure 5. Petrofacies evaluation: Problem – solution.

Figure 6. Petrofacies evaluation: Prediction of thin beds based on openhole logs @ 2 samples /ft cannot delineate between pay and non-pay.

Figure 7. Core description: First step in data analysis.

Figure 8. Comparison of gross lithology: Zafiro-3 vs. Opalo-2 (Core Description @ 100- vs. 20-samples/ft).

Figure 9. Changing core description.

Figure 10. Effect of changing resolution of core description.


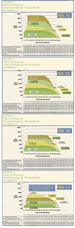
Petrofacies Probabilities for Thin Beds (ISS) 

How Do Petrofacies Probabilities for Thin beds (ISS) Relate to Possible Pay as a Function of:

  • Core Description (Sandstone and Shaly Sandstone)

  • Hydrocarbon Saturation (So)


How Do These Relationships:

  • Change as Probability increases?

  • Appear when plotted as a function of depth?


Zafiro-3 vs. Opalo-2

  • Shaly, conductive thin beds (Oil) vs. Sandy resistive thin beds (Gas)

  • Petrofacies probability of thin beds: 0.75

  • Core description sample rate: 100/ft

  • Core description @ 20/ft shown for comparison.

  • For various values of So and methods used to compute Sw,

    • What is predicted to be pay by the Petrofacies Probability Function?

    • What is actually pay by core description?

  • GOAL: Optimize the value for ISS used in geologic models, so as Not to underpredict the occurrence and volume of thin beds.


     Figures 11-14 

Figure 11. Zafiro-3--Shaly oil reservoir: Core described @ 100 samples/ft; So “Method 1.” From top to bottom, ISS 0.50, 0.75, 0.90. and 1.00.

Figure 12. Zafiro-3: Shaly oil reservoir.

  • Low saturation, high conductivity.

  • Average Rt = 2.7 ohm-m; Min: 0.6 ohm-m; Max: 6.3 ohm-m.

  • ALL CASES: ISS 0.75

Figure 13. Opalo-2--Sandy gas reservoir. Core described @ 100 samples/ft; So “Method 2.” From top to bottom, ISS 0.50, 0.75, 0.90, and 1.00.

Figure 14. Opalo-2: Sandy gas reservoir.

  • High saturation, low conductivity.

  • Average Rt=11.6 ohm-m; Min: 1 ohm-m: Max: 84.8 ohm-m.

  • ALL CASES: ISS 0.75


What are the effects of changing the probability functions and how does this relate to lithology?


     Zafiro-3 (Figures 11 and 12)

  • Shaly, conductive thin beds (Oil).

  • Petrofacies probabilities of thin beds: 0.50, 0.75, 0.90, 1.00.

  • Core description sample rate: 100/ft.


     Opalo-2 (Figures 13 and 14)

  • Sandy resistive thin beds (Gas).

  • Petrofacies probabilities of thin beds: 0.50, 0.75, 0.90. 1.00.

  • Core description sample rate: 100/ft.


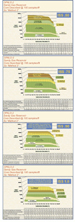
Prediction—Petrofacies and Pay


Figures 15-17 

Figure 15. Left: Percent ISS likely to contain hydrocarbons (“Method 1”--Optimistic)--Zafiro-3 above Opalo-2. Right: Percent ISS likely to contain hydrocarbons (“Method 2”--Conservative)--Zafiro-3 above Opalo-2.

Figure 16. Zagiro-3, net pay predicted by ISS valid by core description at a given probability for a given So. Left: “Method 1”--Optimistic. Right: “Method 2”--Conservative.

Figure 17. Opalo-2, net pay predicted by ISS valid by core description at a given probability for a given So. Left: “Method 1”--Optimistic. Right: “Method 2”--Conservative.


How Much of the Predicted Petrofacies for Thin beds (ISS) is Valid by Core Description at a Specified Probability for a Particular So?


There are several ways to answer this question, using core description as the Benchmark. The most pertinent uses calibration of thin beds as predicted by ISS probability curves to pay valid by core description, for use in uncored wells.


In Cored Wells, for a Given Set of ISS Probabilities and So Values, What % of ISS Is Likely to Be Pay? (Figure 15)


How Does this Ultimately Affect Net Pay? (Figures 16 and 17)


Results from cored wells provide these answers; as So increases, particularly for shaly thin beds, the percentage of ISS valid by core description expressed as a function of net pay, and ultimately gross, decreases.


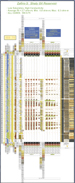
Application to Static Modeling


Serpentina West Model  

     Figures 18-22 

Figure 18. Seismic stratigraphy framework.

Figure 19. Data analysis and iterpretation workflow.

Figure 20. Model inputs and outputs.

Figure 21. Serpentina West depositional architecture.

Figure 22. The thin-bed uncertainty problem: Log total vs. quality ISS.


     Goals

  • Define the sedimentary facies, especially thin bed facies in core for better reservoir models.

  • Integrate cores and open-hole logs to calibrate log-based facies interpretation (Petrofacies).

  • Integrate high-resolution seismic volume interpretation (geobodies) into reservoir model by relating petrofacies and seismic, if possible.

  • Assess possible contributions of thin bed facies to well behavior, potential for future development, and possible reserve adds.


     Results

  • Identified three reservoir facies (PBSS, MFSS, IBSS ) in Zafiro cores and defined, together with non-reservoir facies, the appropriate depositional setting.

  • Defined methodology to create core- to-log calibrated petrofacies and applied this to all wells in Zafiro.

  • Analysis reduced the uncertainty on reserve estimation in Serpentina West.

  • Identified potential well locations for future development.

  • Created workflow to apply learning to other reservoirs.


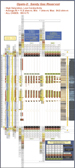
Topacio South 2 (Figures 23-24) 

Figure 23. Weakly confined channel architecture.

Figure 24. Thin-bed examples.


Facies and Petrophysical Modeling 

     Figures 25-33 

Figure 25. Facies modeling: Facies conditioned by seismic.

Figure 26. Seismic conditioning for facies modeling.

Figure 27. Final facies model.

Figure 28. Pitfalls of seismic conditioning for facies modeling.

Figure 29. Facies thickness analysis.

Figure 30. Petrofacies = lower-resolution logs calibrated to high-resolution cores.

Figure 31. Petrofacies prediction uncertainty using standard logs vs. NMR in straight vs. deviated well.

Figure 32. PHI-K relationship for thin beds and massive facies.

Figure 33. Petrophysical modeling – results.

Return to top.