|
uAbstract
uFigure
captions
uIntroduction
uStudy
area
uFacies
uFacies
associations
uPetrography
uStratigraphy
uDepositional
environment
uConclusions
uReferences
uAcknowledgments
uAbstract
uFigure
captions
uIntroduction
uStudy
area
uFacies
uFacies
associations
uPetrography
uStratigraphy
uDepositional
environment
uConclusions
uReferences
uAcknowledgments
uAbstract
uFigure
captions
uIntroduction
uStudy
area
uFacies
uFacies
associations
uPetrography
uStratigraphy
uDepositional
environment
uConclusions
uReferences
uAcknowledgments
uAbstract
uFigure
captions
uIntroduction
uStudy
area
uFacies
uFacies
associations
uPetrography
uStratigraphy
uDepositional
environment
uConclusions
uReferences
uAcknowledgments
uAbstract
uFigure
captions
uIntroduction
uStudy
area
uFacies
uFacies
associations
uPetrography
uStratigraphy
uDepositional
environment
uConclusions
uReferences
uAcknowledgments
uAbstract
uFigure
captions
uIntroduction
uStudy
area
uFacies
uFacies
associations
uPetrography
uStratigraphy
uDepositional
environment
uConclusions
uReferences
uAcknowledgments
uAbstract
uFigure
captions
uIntroduction
uStudy
area
uFacies
uFacies
associations
uPetrography
uStratigraphy
uDepositional
environment
uConclusions
uReferences
uAcknowledgments
|
Figure Captions
|
 |
Figure 1. Location map of the study
area. |
|
 |
Figure 2. Left, black shale. Well:
11-35-44-6W4 @ 590.85m. Right, cross-sectional view of black
shale, showing silty sediments in highly burrowed facies 1A.
Well: 11-4-46-4W4 @ 572m. |
|
 |
Figure 3. Facies 1B, Well ; 6-11-44-6W4.
Left, (601.7m), shale intermixed with very fine sandstone.
Right, (605.2m) showing 2-cm sand lens, interbedded sand and mud
with presence of trace fossils. |
|
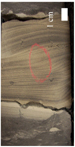 |
Figure 4. Facies 2 (well 6-11-44-6W4),
indicating the fine-grained low-angle argillaceous
cross-stratified sandstone lens @ depth of 606.3m. |
|
 |
Figure 5. Facies 3,  Viking Viking Sand unit.
Left, well: 6-11-44-6W4 @ 607.2m. Middle, well: 7-8-45-5W4 @
539.3m. Right, well: 11-35-44-6W4 @ 596m. Thinner sandstones are
bioturbated; thicker sandstones have preserved low-angle
cross-stratification and lenticular bedding. Sand unit.
Left, well: 6-11-44-6W4 @ 607.2m. Middle, well: 7-8-45-5W4 @
539.3m. Right, well: 11-35-44-6W4 @ 596m. Thinner sandstones are
bioturbated; thicker sandstones have preserved low-angle
cross-stratification and lenticular bedding. |
|
 |
Figure 6. QFL diagram representing three
Viking Sand samples. RW-1 (570.85 m) and RW-2 (584.5 m) from
well 11-4-46-4W4, RW-3 (605.25 m) and RW-4 (604 m) from
10-3-45-6W4. |
|
 |
Figure 7. Lowstand prograding shoreface
creating a RSE which is then followed by subsequent sea level
rise creating a TSE and erosion of some lowstand shoreface
sediments (modified after Walker, 1995). |
|
 |
Figure 8. Depositional environment under
which Viking sediments were deposited. |
|
 |
Figure 9. Schematic diagram showing
surfaces and representative depositional environments of Joli
Fou (1), Viking Transitional sediments (2), Viking Sand (3),
Viking Sand erosion (4), and subsequent seaward transportation
by the storms and waves, Viking Transitional sediments (5), and
the Westgate Shale (6).
Click to view sequence of
environments from Joli Fou to Viking to Westgate. |
Return to top.
The Viking Formation was deposited within the
Western Canadian foreland basin during Albian time, Early Cretaceous.
The Viking Formation consists of the lower offshore transitional
sediments, the Viking sand unit and the upper offshore transitional
sediments. The Viking sand unit was deposited as a thin sand sheet in a
shoreface environment during a lowstand, related to a forced regression.
The base of the Viking Sand unit can be interpreted as a Regressive
Surface of Marine Erosion (RSME) as coarse shoreface sands overlie the
lower offshore transitional sediments. A transgression took place to end
the deposition of the Viking Sand unit and consequently parts of the
lowstand shoreface deposits (i.e., Viking Sand unit) were reworked and
redistributed to form linear sand bodies trending NW-SE, creating a
Transgressive Surface of Erosion (TSE). The TSE is overlain by upper
offshore transitional sediments, which were deposited during a
subsequent sea level stillstand. The upper boundary of the Viking
Formation is distinguished by a basin-wide Transgressive Surface of
Erosion (TSE), marking the end of Viking deposition and onset of
deposition of marine shales of the Westgate Formation.
The study area is located in the
Edgerton/Wainwright area in east-central Alberta from NW 45-5W4 to SE
44-4W4 (Figure 1). The study consists of
data that have been collected from 397 well logs as well as core logs
from 2 cored intervals from within the study area and 4 cored intervals
from the immediately surrounding townships.
Five facies have been defined for the regional
study area T44 to T45 and R4W4 and R5W4. These facies have been grouped
into four facies associations, on the basis of dominant lithology.
Facies 1A: (Figure 2)
Shales that are usually black or grey with abundant fish scales and
minor plant debris near the top (Hein, 1986). Within the study area the
shales range in thickness from 37m to 70m and average approximately 48m
from the base of Fish Scales to the top of the Viking Formation.
Intensive burrowing has lead to marine offshore shale that has the
presence of very fine grained to silty quartz grains (Figure
2). Small rippled, very fine
grained sandstones are sporadically interbedded within the shale.
Sideritized units up to 12cm thick can also occur throughout this
facies.
Facies 1B: (Figure 3)
Offshore transitional shales that occupy the Viking Formation above and
below the Viking Sand unit. Within the study area these shales average
14m in total thickness. There is sporadic pyritized plant debris, with
moderate burrowing and an increase in the quartz amount found within the
shale. The presence of small <2cm sized sand lenses with cross
stratified bedding increase in abundance up in the succession, towards
the Viking Sand unit.
Facies 1C: Joli Fou shale, lying below Viking
Formation. Black to grey with massive texture, completely homogenous.
Facies 2: (Figure 4)
Interbedded shale and fine grained sandstone. Contains argillaceous
laminations with wavy to low angle sandstone lenses, with minor
burrowing. Lenses range from 2 – 5cm in thickness. Sandstones are fine
grained and contain a variety of low angle cross stratified sandstone
lenses.
Facies 3: (Figure 5)
Muddy sandstone facies is characterized by laminated to structureless
beds with fine to medium grained sandstones. Thinner sandstones are more
heavily bioturbated while thicker sandstones have preserved low-angle
cross-stratification. Thickness ranges from 0.8m to 2.5m, moving SE to
NW respectively. In core samples the Viking sand unit can be demarcated
by moderately bioturbated, upper very fine- to medium-grained sands,
with porosities ranging from 5 - 30%.
Facies Association 1: Shale (Westgate Shale)
contains subfacies 1A.
Facies Association 2: Fine-Grained Sandstone
contains subfacies 1B and Facies 2.
Facies Association 3: Interbedded Sandstone
and Shale contains facies 3.
Facies Association 4: Bioturbated Shale
contains subfacies 1C.
These facies associations form a consistent
vertical stacking pattern within the study area and follow the following
general sequence:
4
g 3
g 2
g 1
Four samples were taken for petrographic
analysis. Three of the four were plotted in a triplot QFL diagram for
classification (Figure 6) and are from the
Viking Sand interval. Each sample was normalized using quartz, lithics,
and feldspar content. The fourth sample analyzed was a mudstone that
contained over 75% mud matrix and is found in Facies 1A. Sample RW-2 (Facies
3) normalized contains 59% Quartz, 39% Lithics, and 2% Feldspars, with
4% porosity. Mud matrix comprises 35% of sample RW-2. RW-3 (Facies 3)
normalized contains 63% Quartz, 36% Lithics, and 1% Feldspars with 8%
porosity, while the mud matrix comprises 28% of this sample. RW-4 (Facies
3) normalized contains 65% Quartz, 32% Lithics, and 3% Feldspars with 4%
porosity. Mud matrix on the order of 40% comprises sample RW-4.
The Viking Formation represents an overall
regressive package that is overlying the regional highstand and
transgressive (Leckie, 1986) Joli Fou Shales (Facies 1C) and underlying
the transgressive Westgate Shales (Facies 1A) and has been termed a
regional shelf-to-shoreface sequence by Reinson et al (1988). The
overall facies succession that is present consists of offshore marine
shales (Joli Fou and Westgate Shales, Facies 1B and 1A), transitional
sandy mudstones (Viking, Facies 1C & 2) and the lower shoreface muddy
sandstones (Viking Sand unit, Facies 3) (Figure
8).
Much of Viking deposition in central Alberta
is the result of a lowering of relative sea level that corresponds to
the worldwide event that occurred around 97 m.y. (Vail et al, 1977).
Figure 7 shows this shoreface stacking model
with locations 2-4 being correlative to the area in this study.
The Joli Fou (Facies 1C) is a basin wide
formation that disconformably overlies the continental sands of the
Mannville Formation while disconformably underlying the Viking
Formation. To mark the end of deposition a major sea level regression
took place, creating the erosional discontinuity defined as a RSE (Figure
9.2).
The transitional sandy mudstones of the Viking
Formation (Facies 2 and 1B) were deposited between the fair weather wave
base and the storm wave base (Figure 8).
This lower portion of the offshore transitional sediments within the
Viking are overlain by the Viking Sand unit (Facies 3) and underlain by
the Joli Fou marine shales. The contact between the Viking and the
Viking Sand is denoted as a RSME that was caused by the continued
regression or fall of relative sea level (Figure
9.3) and is denoted by a sharp increase in gamma ray and resistivity
on logs which can be defined in core by a increase in sand and grain
size. This RSME marks the beginning of Viking Sand deposition.
Following a time of lowstand progradation,
transgression was reactivated creating a TSE (Figure
9.4). This surface is defined by a sharp decrease in gamma ray and
resistivity on logs while in core it is denoted by the change in
shoreface sands (Facies 3) to a mud dominated sand (Facies 2 and 1B).
These lower shoreface sediments (Facies 3) were consequently
redistributed as large linear NW-SE trending sand bodies.
A time of sea level stand still commenced and
the thick 8-10m Viking offshore transitional sediments (Facies 2 and 1B)
were deposited (Figure 9.5) between the fair
weather wave base and the storm wave base (Figure
8). A basin wide TSE occurred as
sea level rose and the shoreface moved proximally to the west, thus
beginning the deposition of offshore sediments (Facies 1A). This TSE is
characterized by a decrease in gamma ray and resistivity, while in core
is represented by a decrease in sand content by abundance of sand
lenses. Strikingly absent is the characteristic transgressive pebble lag
that typically denotes the contact between the Viking Formation and the
Westgate Shales above.
The Westgate Shale (Facies 1A) is separated
from the Viking formation by the previously mentioned major basin wide
TSE (Figure 9.6). This erosional surface is
the result of a reactivation in the relative sea level rise.
Consequently, the deposition of the dark grey, non-calcareous offshore
marine shales with rare centimeter sized interbedded sandstone lenses
were deposited below the storm wave base (Figure
8).
Above the Westgate Shales is the Base of Fish
Scales Zone. This zone is a basin wide marker bed that delineates the
Albian/Cenomanian (lower/upper Cretaceous) boundary. This zone is
identified by its abundant fish scales and shallow marine fauna within a
finely laminated siltstone. Due to this zones continuous characteristics
throughout the basin it will be used as the datum for this study.
There have been five facies defined within the
study area along with four facies associations. The shale facies can be
divided into three separate subfacies: 1a, 1b, and 1c. These represent
the Westgate, Westgate-Viking Transition and the Joli Fou sediments,
respectively. Facies 2 represents the Viking Formation and an increase
in the physically structured sand lenses and preserved burrows. Finally,
Facies 3 represents the Viking Sand unit which contains highly preserved
burrows and fine- to medium-grained sands characteristic of lithic
wackes (>15% matrix) according to a QFL diagram. The Viking Formation in
central Alberta forms a lowstand prograding shoreface that follows a
typical coarsening upward sequence. The formation varies in thickness
throughout the study area, but shows an overall increase towards the
sediment source in the NW.
Stratigraphically, following Joli Fou
deposition a regression commenced that created a RSE, this surface marks
the beginning of the Viking Formation. Within the Viking Formation a
RSME was caused by an overall fall in relative sea level, it is this
regression that marks the beginning of the Viking Sand unit’s deposition
within the Viking Formation. A prograding shoreface developed due to a
sea level stand still and an influx of sediments from the west. This
stand still ceased upon the reactivation of sea level rise and a TSE was
created. This transgression eroded, reworked and redistributed much of
the shoreface sediments that now comprise the Viking Sand unit. The
shoreface was now located to the west and sea level was at a relative
stand still for a time, allowing the remainder of the Viking sediments
to be deposited. The end of Viking deposition is marked by a basin wide
transgressive event that resulted in a final TSE that can be traced
throughout the basin. Consequence of this basin wide transgression was
the deposition of the Westgate Shales which reach thicknesses of 70m
within the study area.
Hein, Frances J., and Dean,
Michael E, 1986. The Viking Formation in the Caroline, Garrington, and
Harmattan East Fields, Western South-Central Alberta: Sedimentology and
Paleogeography. Bulletin of Canadian Petroleum Geology, v. 34, no. 1, p.
91- 110.
Leckie, D.A., 1986, Tidally
influenced, transgressive shelf sediments in the Viking Formation,
Caroline, Alberta: Bulletin of Canadian Petroleum Geology, v. 34, no. 1,
p. 111-125.
McBride, E.F., 1963, A
classification of common sandstones: Journal of Sedimentary Petrology,
v. 33, no. 3, p. 664-669.
Reinson, G.E., Clark, J.E., and
Foscolos, A.E., 1988. Reservoir geology of the Crystal Viking field, a
Lower Cretaceous estuarine tidal channel-bay complex, south-central
Alberta: AAPG Bulletin, v. 72, p. 1270-1294.
Vail, P.R., R.M. Mitchum Jr.,
S. Thompson III, 1977, Seismic stratigraphy and global changes of sea
level: Part 4. Global cycles of relative changes of sea level: Section
2. Application of seismic reflection configuration to stratigraphic
interpretation, in Seismic Stratigraphy--Applications to
Hydrocarbon Exploration: AAPG Memoir 26, p. 83-97.
Walker, Roger G., 1995,
Sedimentary and tectonic origin of a transgressive surface of erosion:
Viking Formation, Alberta, Canada: Journal of Sedimentary Research, v.
B65, no. 2, p. 209-221.
Webber, J.D., 1997, Development
of a regional high resolution stratigraphic framework for the Late
Albian Viking Formation in East Central Alberta and West Central
Saskatchewan: Masters Thesis, University of Regina, Regina Saskatchewan,
71 p. Formation in East Central Alberta and West Central
Saskatchewan: Masters Thesis, University of Regina, Regina Saskatchewan,
71 p.
I would like to thank Talisman Energy Inc for
providing the information and supporting this undergraduate research
project. I would also like to thank Jennifer Squance and George Castles
of Talisman Energy Inc. for their support in this project, as well as
Dr.
Quoxiang Chi from the University of Regina, and Per Pedersen of Apache
Canada.
Return to top.
|