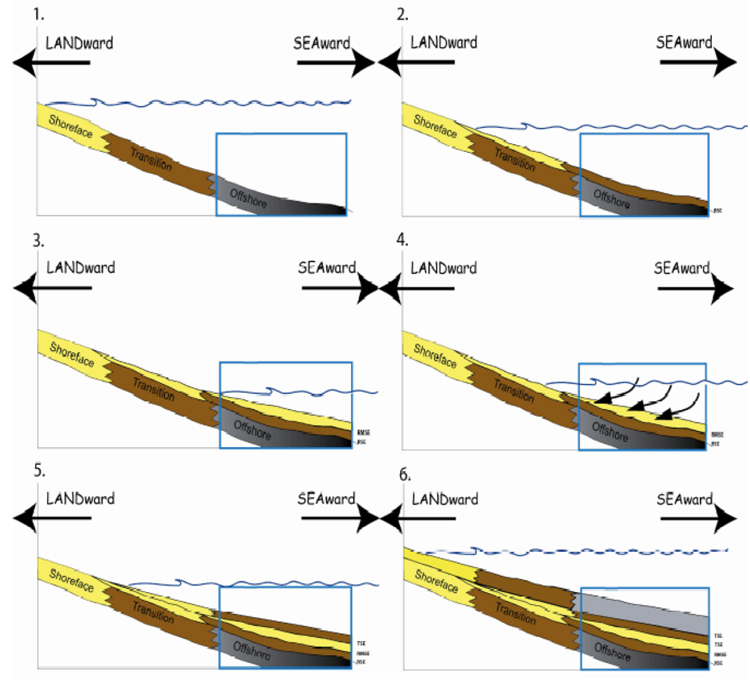
Figure 9. Schematic diagram showing surfaces and representative depositional environments of Joli Fou (1), Viking Transitional sediments (2), Viking Sand (3), Viking Sand erosion (4), and subsequent seaward transportation by the storms and waves, Viking Transitional sediments (5), and the Westgate Shale (6).
Click to view sequence of environments from Joli Fou to Viking to Westgate.