 Click
to view presentation in PDF format
Click
to view presentation in PDF format
Click to view posters in PDF format:
2) Production, Reserves, Resources
Coalbed Methane in the United States: A GIS Study*
By
Samuel H. Limerick1
Search and Discovery Article #10066 (2004)
*Adapted from a poster presentation at AAPG Annual Meeting, Dallas, Texas, April 18-21, 2004.
1Z, Inc. / Energy Information Administration, Reno, NV ([email protected])
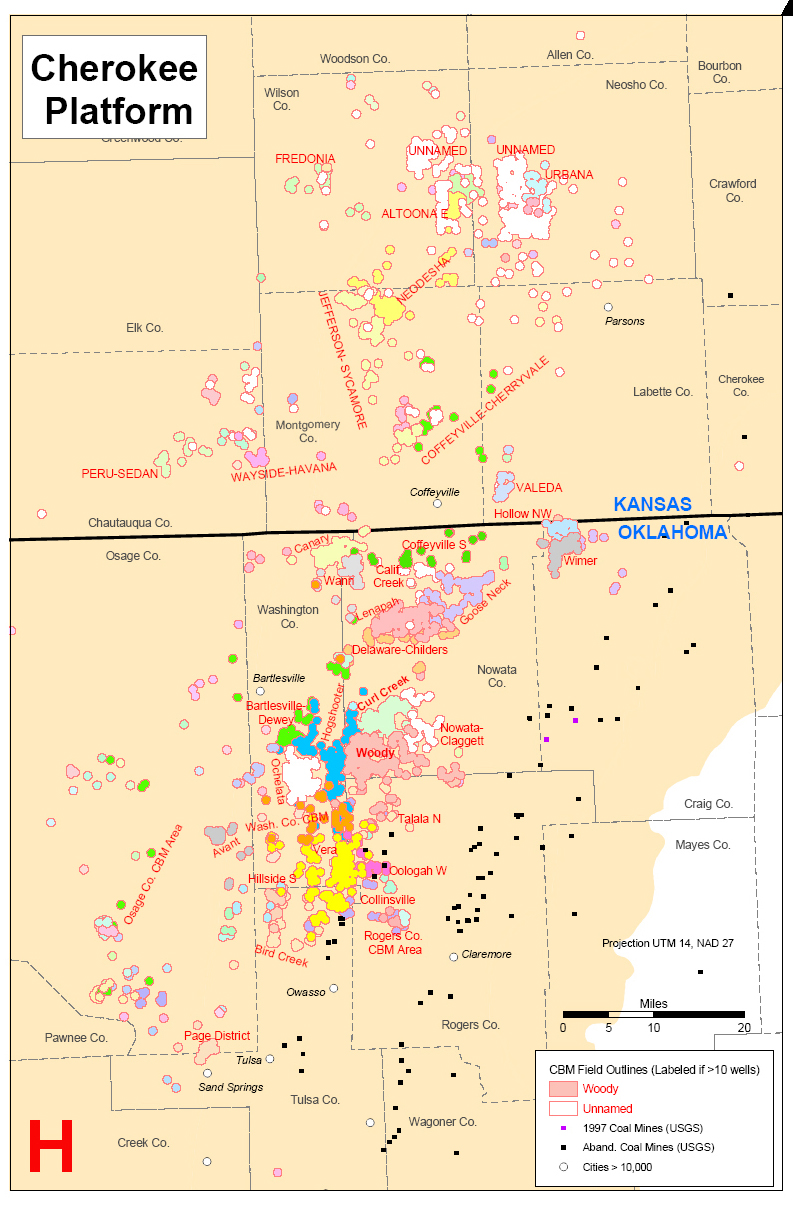
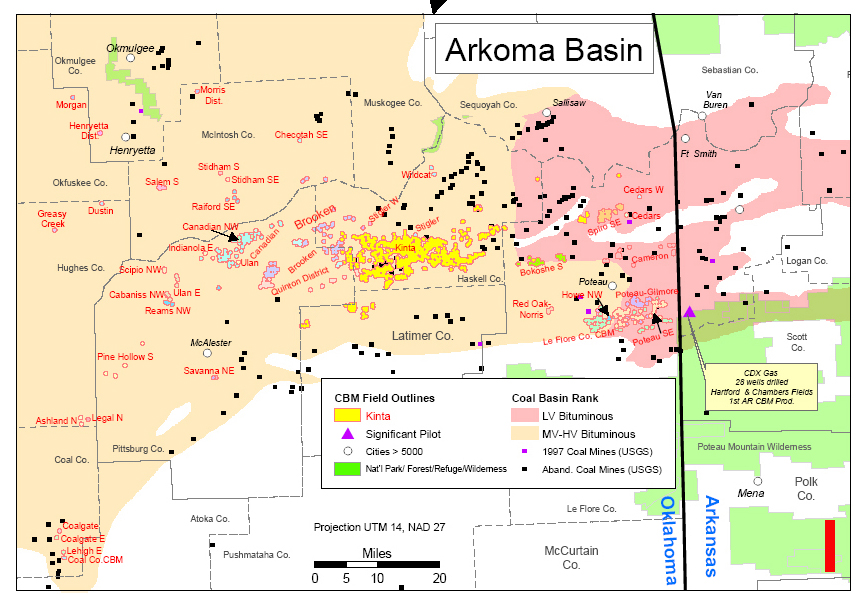
A map of coalbed methane (CBM) gas field outlines in the US was built using ESRI ArcGIS software. The field outlines are displayed on a background of USGS and Alaska DNR coal basins along with active and abandoned coal mines. Inset maps show details of the 10 most active CBM basins. Well data for the field outlines was obtained from 18 state geological surveys or oil and gas commissions. Field outlines were constructed by buffering the wells from each field with a radius based on their spacing, then unioning the buffers to make a single polygon record per field name. A visual basic applications program within ArcGIS was used to automate the buffering process (necessary with >35,000 wells and > 350 fields).
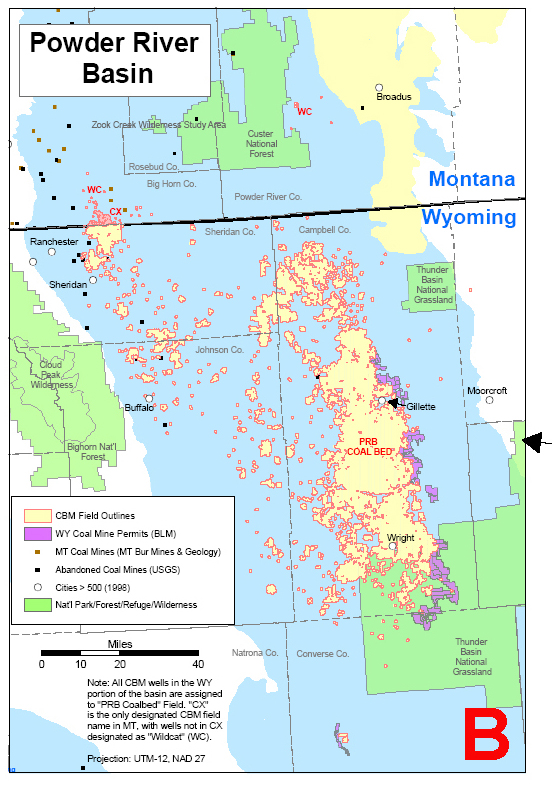
CBM past production (from the state oil and gas commissions), present proved reserves (Energy Information Administration [EIA]) and future resources (Potential Gas Committee) were classified by basin and displayed as chloropleth maps and pie charts. Comparison of these shows the decline in relative contribution over time of the San Juan and Black Warrior Basins and the ascent of the Powder River Basin.
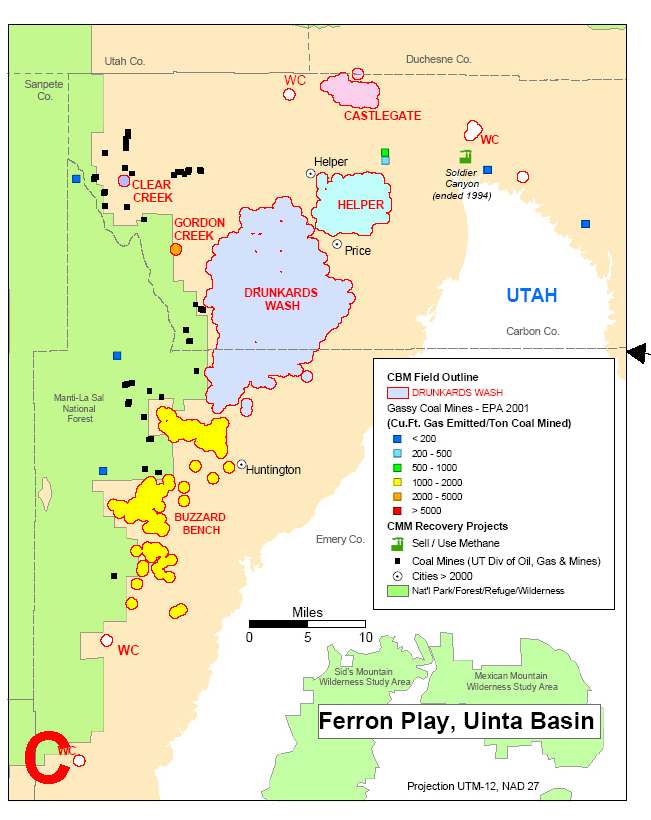
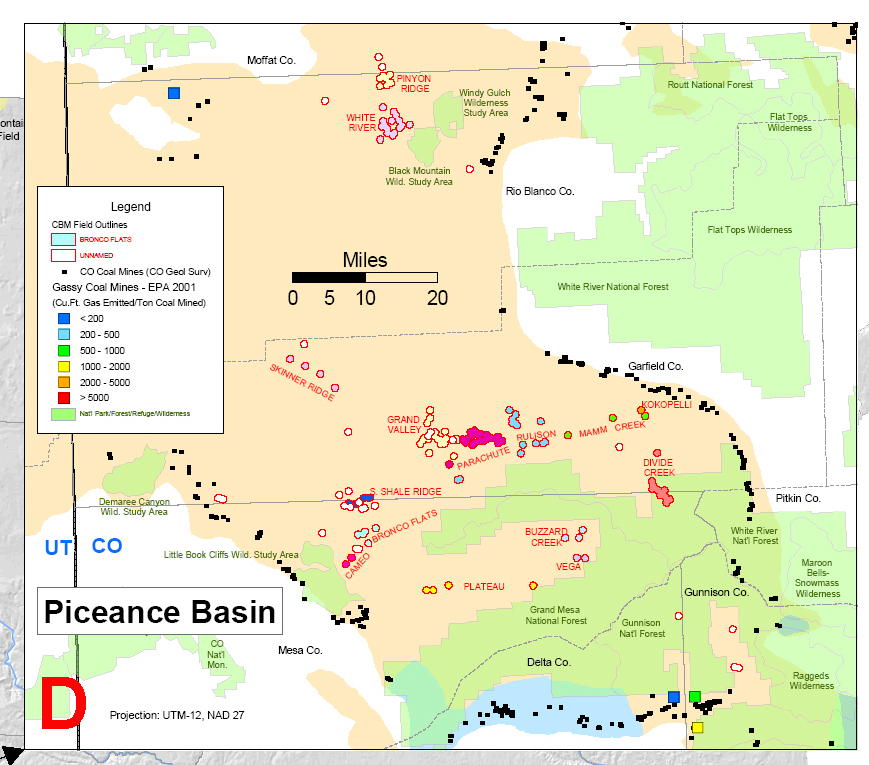
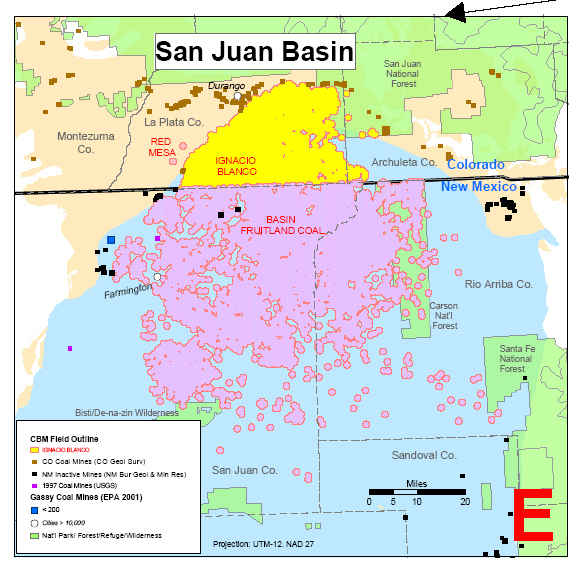
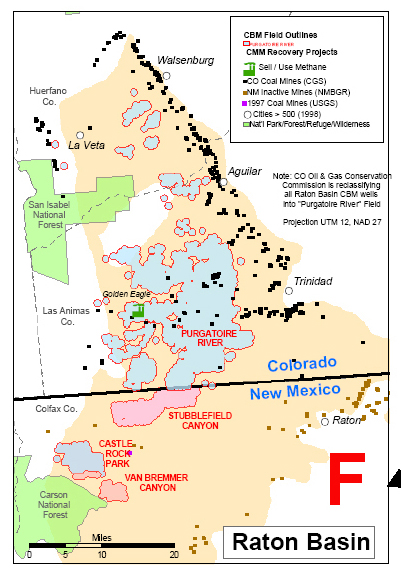
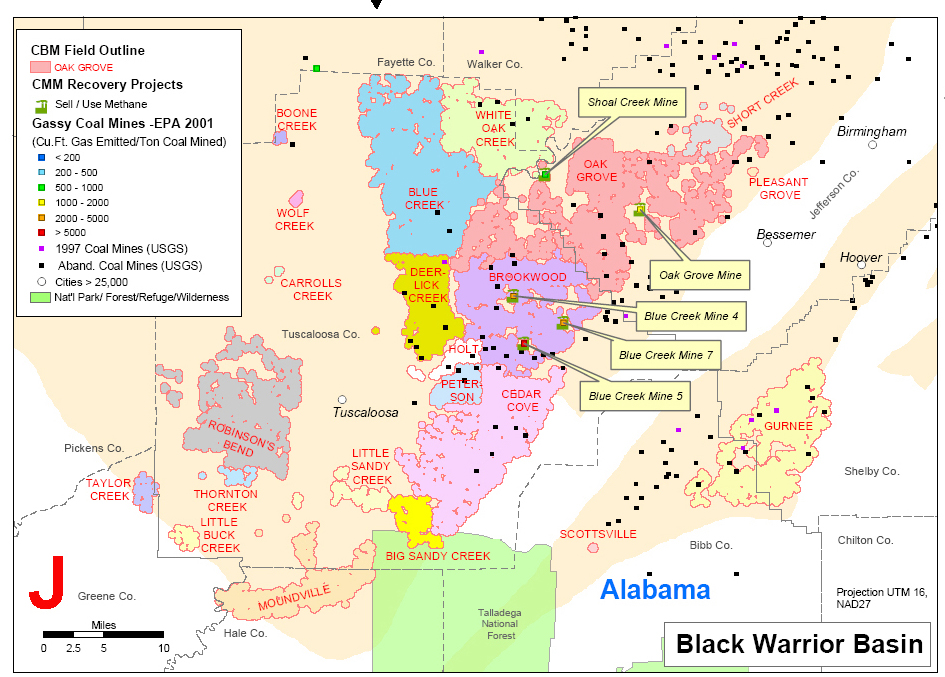
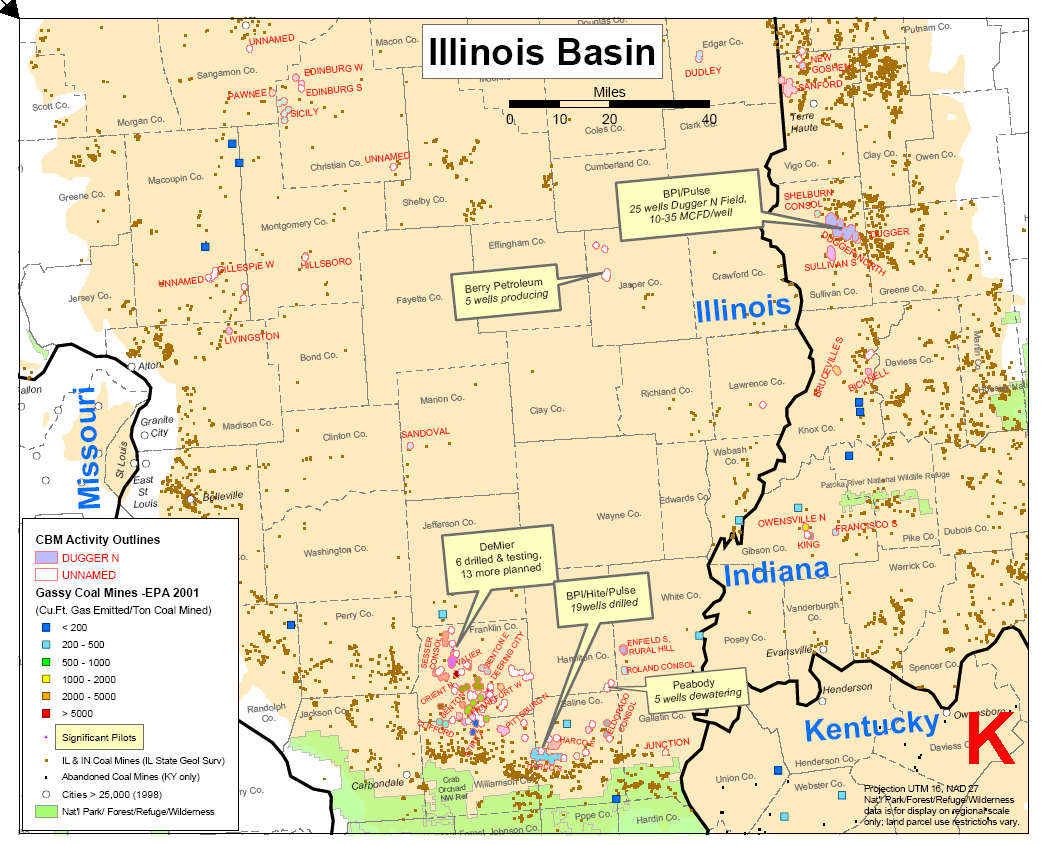
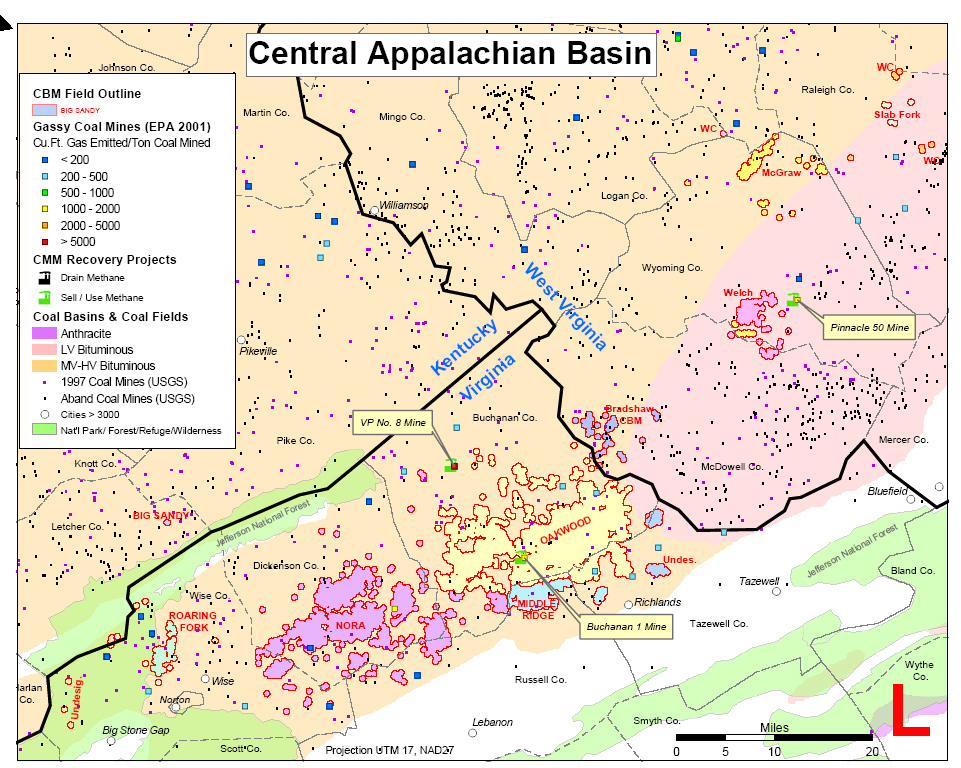
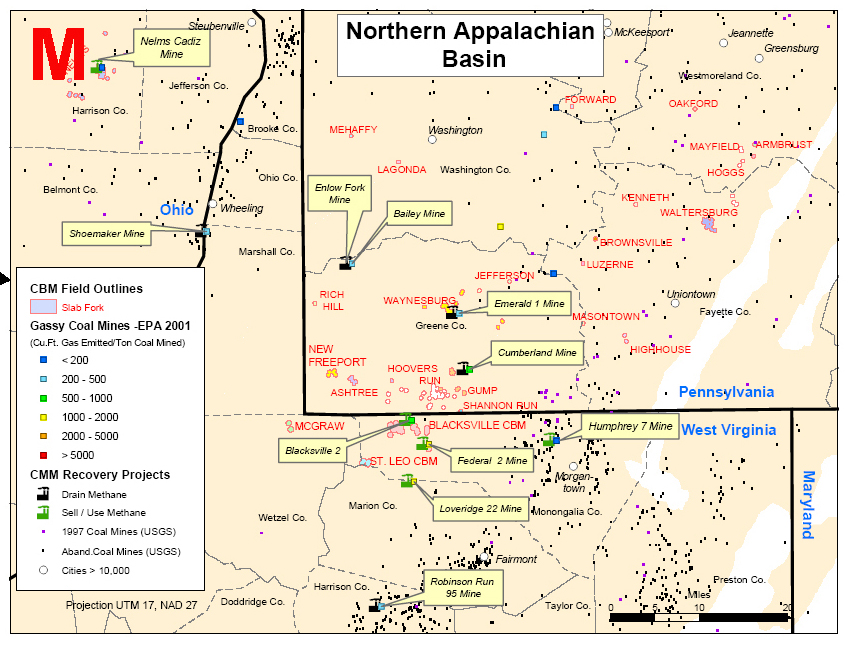
Specific emissions (annual gas emitted / coal produced) of the EPA’s 121 gassiest active coal mines were calculated and mapped. The greatest number of gassy coal mines is located in the Appalachian basin, while the Black Warrior Basin has the highest mean specific emissions.
The workflow for the project is summarized as follows:
· Built map of coalbed methane (CBM) fields in United States
Created CBM field outlines from states’ well data
Expanded upon Gas Technology Institute’s 2001 CBM Resource Map
· Compared CBM basins by:
Past production, present reserves, future resources
GIS, which helps visualize basin differences
· Integrated Coal Mine data into map
Characterized basins by active mine gas emissions
|
uProduction, reserves, resources
uProduction, reserves, resources
uProduction, reserves, resources
uProduction, reserves, resources
uProduction, reserves, resources
uProduction, reserves, resources
uProduction, reserves, resources
uProduction, reserves, resources
uProduction, reserves, resources
uProduction, reserves, resources
uProduction, reserves, resources
|
Coal Bed Methane (CBM): BasicsDefinition of Coalbed Methane (CBM) · Natural gas generated by and stored within coal seams underground · Recoverable by conventional gas wells · CBM -gas recovered from virgin coal seams using gas wells · CMM -“Coal Mine Methane” –when released during mining operations
History of gas production from coal seams
Importance of CBM to U.S. gas supply (Figure 1) · 8% of US gas production (Energy Information Agency [EIA, 2003]) · 10% of US gas reserves (EIA, 2003) · 15% of undiscovered US gas resources (Potential Gas Committee [PGC], 2002)
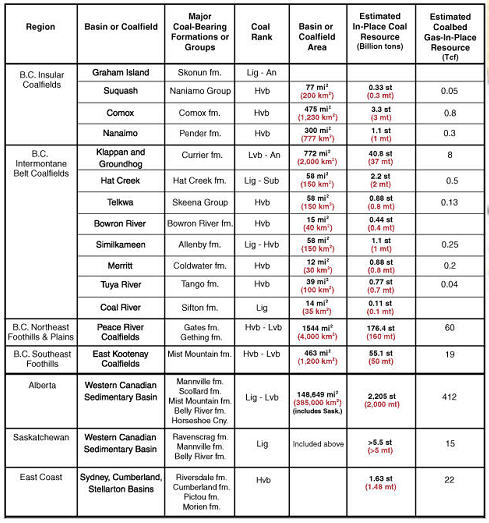
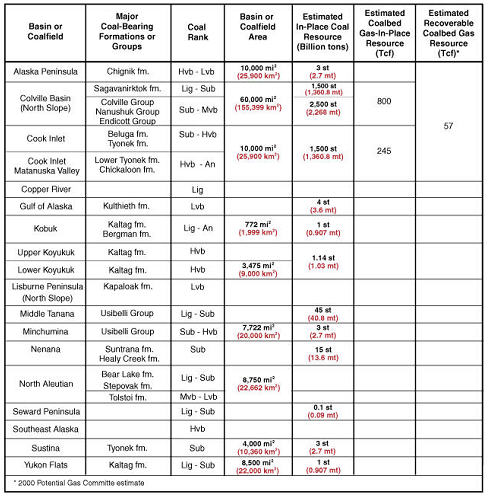
Coal Basins of the United States (Figure 2) Importance of coal basins
Status of studies
Tully (1996) OFR #96-92, for Lower 48 States Milici (1995) NOGA, for East Coast basins Prof. Papers 1625 A-D (1999-2002) for Rocky Mountains and Illinois
Merritt and Hawley (1986), coal resources Ehm (1983), oil and gas basins
Coalbed Methane FieldsCBM field outline layer was created from well data. Digital well data were obtained from 18 states: Web download –5 Purchased –3 Obtained works in progress –7 USGS or PTTC source –3 As shown in Figure 3, in ArcGIS, wells were buffered with a radius; then polygons were unioned, with the resulting union designated by FIELD_NAME (e.g., Figure 4). Buffer distance was determined as follows and is illustrated in Figure 5: Buffer distance = function (standard well spacing unit size) States’ minimum well-spacing rules as starting point; e.g., New Mexico: 320 acre/well in San Juan; 160 acre/well in Raton It was automated with VBA (code by K. Kuykendall).
Coalbed Methane Production, Reserves, and Resources
The Past: Coalbed Gas Production The map of CBM annual production (Figure 7B) reflects the following: Data from states’ oil and gas commissions Classification of production by basin Data accuracy caveats, which are usually under-reported: Some states track production by lease, not well. If there are no unique names for CBM and non-CBM fields, it is difficult to separate production. Wells recompleted from non-CBM zones may not be recorded. Older wells: CBM are not separated from non-CBM production. Some states do not enforce reporting rules.
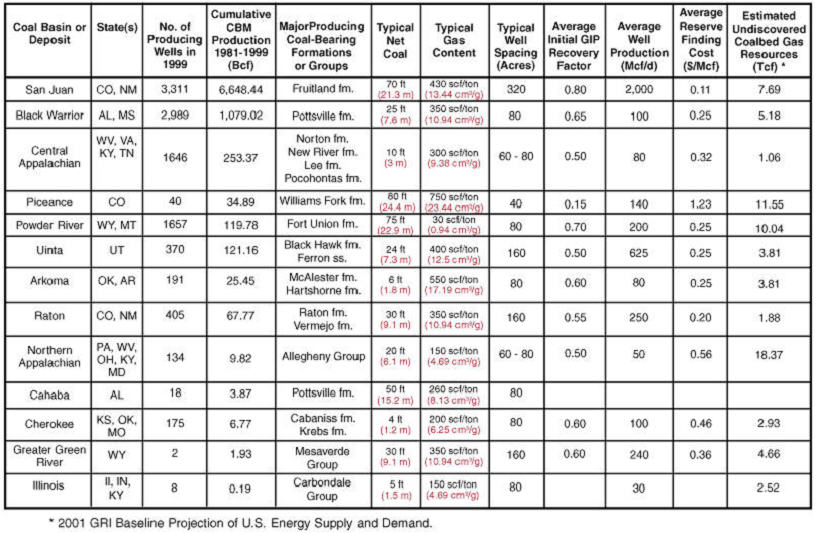
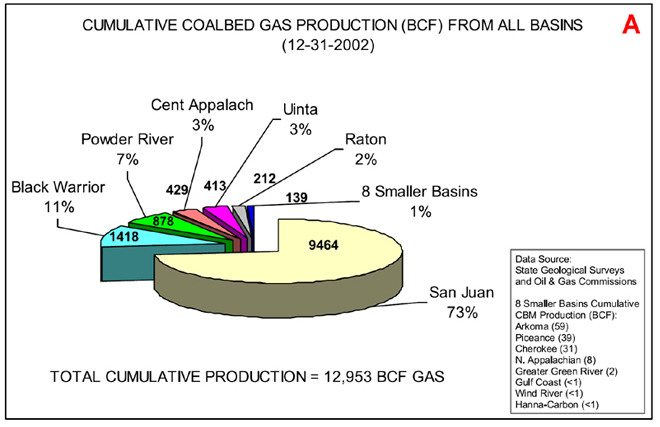
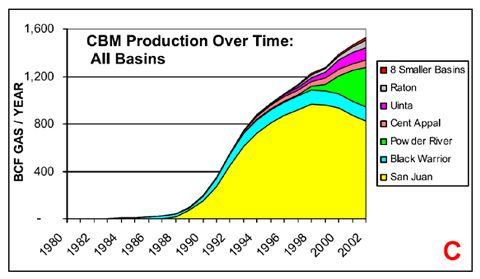
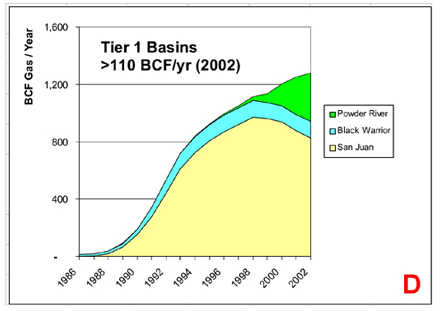
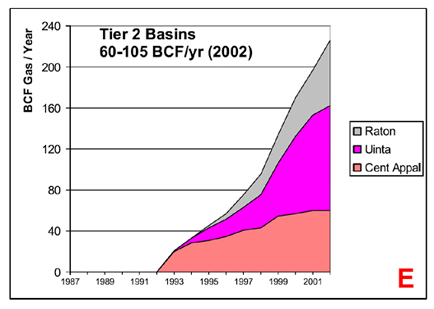
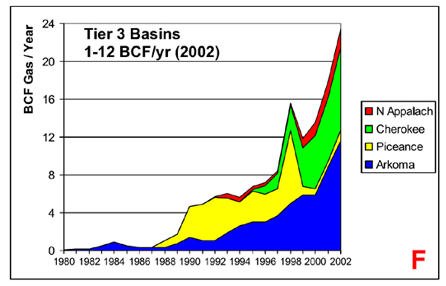
Annual coalbed methane gas volume data through 12/31/2002 were obtained from 14 state oil and gas regulatory entities or geological surveys. Produced CBM gas volumes from each state were classified by basin. The sum of all reported CBM gas volumes per basin through 2002 is shown as the cumulative production pie chart in Figure 7A. CBM production volumes over time for all basins are shown graphically in Figure 7C. The most obvious trends are (1) the dominance of the San Juan Basin since the late 1980s, beginning a decline in 1999; and (2) the rapid increase for the Powder River Basin from the late 1990s. The CBM basins are subdivided into three tiers based on 2002 annual production volumes, shown as graphs in Figure 7D, E, and F. Note the change in vertical scale between the graphs. Tier 1 (>110 BCF/year) includes the San Juan and Powder River Basins plus the Black Warrior (steady at ~115 BCF/year) (Figure 7D). Tier 2 (60-105 BCF/year) is composed of three basins with significant production additions since 1992-1995: Raton, Uinta, and Central Appalachian Basins (Figure 7E). The graph for tier 3 (1 - 12 BCF/year) looks more spiky than the other two because the vertical scale is more stretched out. This graph contrasts growing production in the Arkoma and Cherokee Basins with declines in the Piceance Basin (Figure 7F). To visualize the relative cumulative production volumes per basin in map view, a chloropleth map (Figure 7A) was made.
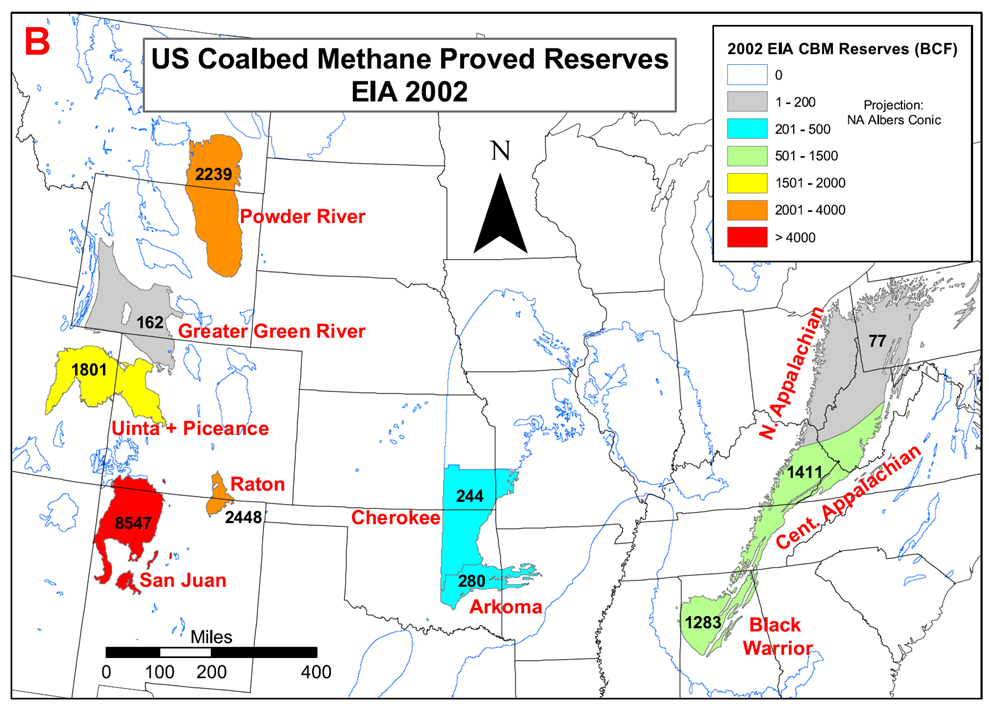
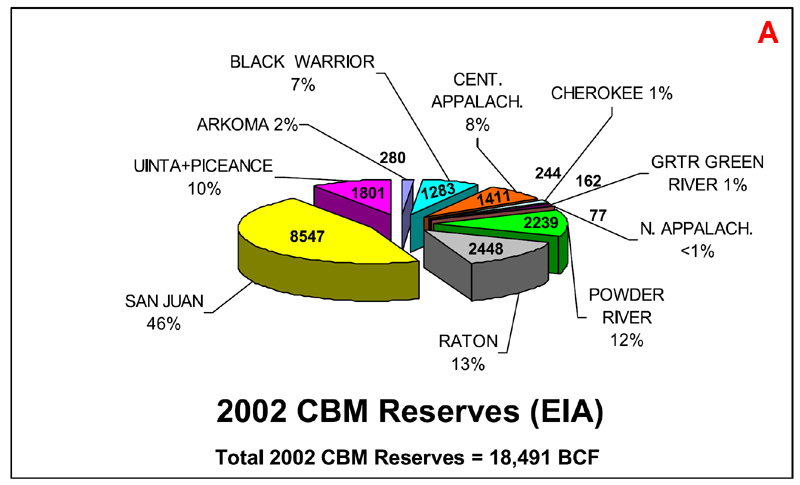
The Present: CBM Proved Reserves The map of proved CBM reserves (Figure 8B) reflects: Its source: 2002 EIA Reserves Survey Classification by basin Data caveats It does not include small operators. Uinta + Piceance basins are aggregated for operator confidentiality.
Proved reserves are the quantities of gas that geologic and engineering data demonstrate with reasonable certainty to be recoverable in future years from known reservoirs under existing economic and operating conditions. Proved reserves data are from the EIA’s US Crude Oil, Natural Gas, and Natural Gas Liquids Reserves, 2002 Annual Report. Caveats for this dataset include: (1) only large production volume operators report to the survey; so small volume operators (<2BCF total gas/ year) will be missed, (2) Uinta + Piceance basins are aggregated for reporting to protect confidentiality of operator’s estimates. The pie chart (Figure 8A) shows the division of proved reserves by basin using 2002 EIA data. When the percentages by basin on that chart are compared to the cumulative production pie chart (Figure 7A), the relative proportion of total CBM for the San Juan Basin has dropped from 73% to 46%, while the Powder River Basin’s share has increased from 7% to 12%. A chloropleth map (Figure 8B) provides a visual display of the relative proved reserves per basin.
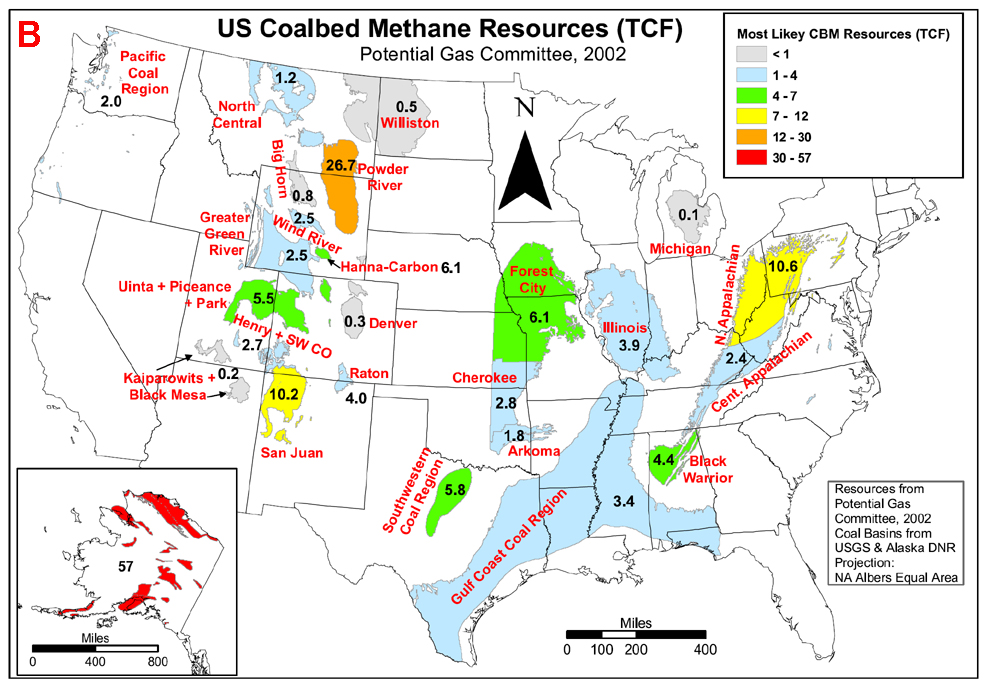
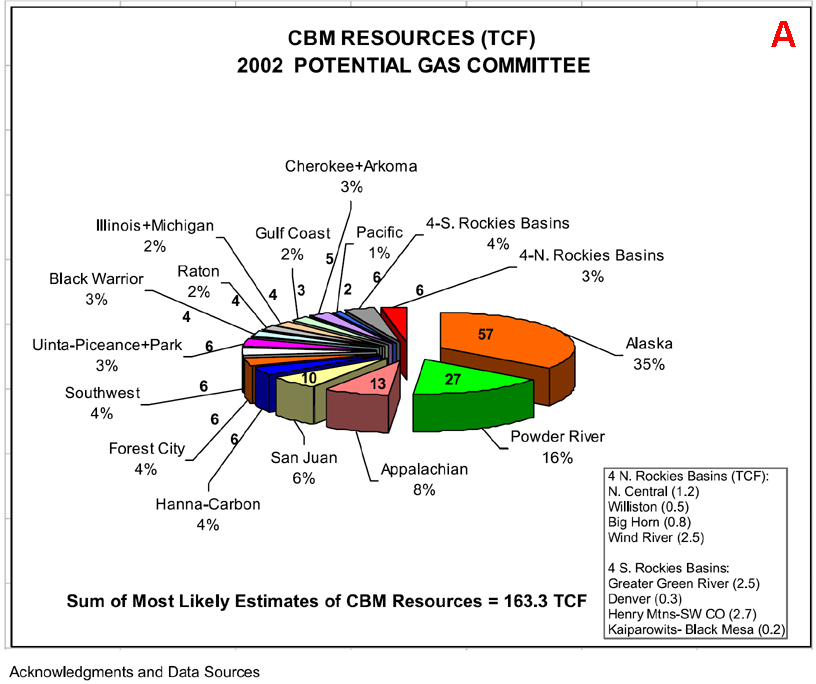
The Future: CBM Undiscovered Resources Resources are the most likely estimates of undiscovered, technically recoverable and marketable volumes of hydrocarbons. Estimates shown on the map in Figure 9B are from Potential Supply of Natural Gas in the United States, Report of the Potential Gas Committee, 12/31/2002 (www.mines.edu/research/pga/index.html). The committee is composed of volunteer experts from the gas industry, government, and academia. The relative portion of each basin’s resource potential is shown on the pie chart in Figure 9A. Some PGC basins have been aggregated in the pie chart to reduce the number of pie slices. A map delineating the areas of assessed resources was not supplied with the PGC report; so the resource estimates were assigned to the basin areas on the chloropleth map (Figure 9B), based on the Coal Region/Basin/Field given in the report. The production and reserve trends, noted above, continue, with the mature San Juan Basin falling to 6% of the total and the emerging Powder River Basin rising to 16%. Alaska dominates the graph with 35%, but note that Alaska is composed of multiple basins aggregated together, whereas most basins of the lower 48 basins stand alone. Given their relatively small size, the Raton, Hanna-Carbon, Pacific, and Wind River basins rank relatively high.
Coal mine data sources at regional scale for preparation of the map in Figure 10 are:
Approx. equal #’s underground & surface (strip) Portal vs. centroid Locations only partially verified
Only a partial estimate
More upgrade dollars since 2002 Quecreek, Pennsylvania, accident
Irani et al. (1972, 1974), Trevits/Finfinger et al. (1993) ~ 500 mines, most in Appalachian region
Normalize to compare “gassiness” of mines: Specific Emissions = annual CF gas emitted/ ton coal mined
EPA’s Coalmine Emission Outreach Program (CMOP), since 1994, has tracked the “gassiest” active underground coal mines to promote CMM recovery—and for profit and greenhouse gas reduction. Methane = 21 X potency of CO2 as greenhouse gas. By 2001 EPA had gathered emission data for 121 gassy mines, measured by MSHA four times per year. There is a link by MSHA-ID to: Mine location shapefile File with tons coal mined/year CMOP has calculated specific emissions and has plotted graphically and mapped these attributes (Figures 11, 12, and 13).
CBM Fields in the US have been mapped. Map of coalbed methane (The Big Map) is available from EIA in pdf format (http://www.eia.doe.gov >Natural Gas >Resources & Reserves > Maps); field outline shapefile is available on request. CBM production/reserves/resources are summarized with maps and charts and they are also available in pdf format. GIS is used to characterize coal basins by mine gassiness.
References, Data Sources, and Acknowledgments Ehm, A., (compiler), 1983, Oil and gas basins map of Alaska: Alaska Department of Natural Resources. Flores, R.M., et al., 1999, National coal resource assessment non-proprietary data; location, stratigraphy, and coal quality of selected Tertiary coal in the Northern Rocky Mountains and Great Plains region: U.S. Geological Survey Open-File Report No.OF 99-00376, 12p.
Fort Union Coal Assessment Team, 1999, 1999 Resource
assessment of selected Tertiary coal beds and zones in the Northern
Rocky Mountains and Great Plains region: U.S. Geological Survey
Professional Paper No.P 1625-A. Irani, M.C., P.W. Jeran, and M. Deul, 1974, Methane emission from U.S. coal mines in 1973. A survey--supplement to Information Circular 8558: U.S. Bureau of Mines Information Circular 8659, 47 p. Kirschbaum, M.A. et al., (eds.), 2000, Geologic Assessment of coal in the Colorado Plateau; Arizona, Colorado, New Mexico, and Utah: U.S. Geological Survey Professional Paper No.P 1625-B. Merritt, R.D., and C. C. Hawley, compilers, 1986, Map of Alaska's coal resources: Alaska Division of Geological and Geophysical Surveys Special Report 37, scale: 1:2,500,000, 1 sheet. Milici, R.C., 1995, Blue Ridge Thrust Belt Province (068), Piedmont Province (069), Atlantic Coastal Plain Province (070), Adirondack Uplift Province (071), and New England Province (072), in Gautier et al., eds., 1995 National assessment of United States oil and gas resources-Results, methodology, and supporting data: U.S. Geological Survey Digital Data Series 30. Northern and Central Appalachian Basin Coal regions Assessment Team, 2001, 2000 Resource assessment of selected coal beds and zones in the Northern and Central Appalachian basin coal regions: U.S. Geological Survey Professional Paper No.P 1625-C. Trevits, M.A., Finfinger, G.L., and LaScola, J. C., 1993, Evaluation of U.S. coal mine emissions--For presentation at February 1993 SME annual meeting in Reno, NV: Society for Mining, Metallurgy and Exploration, Inc. Preprint no. 93-154, 7p. Wood, G.H., Jr., and W.V. Bour, III, 1988 Coal Map of North America: U.S. Geological Survey. Tatch, Jr. and R.H. Affolter (eds.), 2002, Resource assessment of the Springfield, Herrin, Danville, and Baker coals in the Illinois Basin: U.S. Geological Survey Professional Paper No.P 1625-D. Tully, J. (compiler), 1996, Coal fields of the conterminous United States: U.S. Geological Survey Open-File Report No. OF96-92 (map
Well Data for Field OutlinesAlabama State Oil & Gas Board (H. Moore), Geological Survey of Alabama (J. Pashin), Colorado Oil & Gas Conservation Commission (J. Milne), Illinois State Geological Survey (D. Morse), Indiana Geological Survey (J. Rupp), GTI-TICORA (T. Lombardi), Dorado Gas Resources (S. Tedesco), Kansas Geological Survey (T. Carr), Kentucky Geological Survey (B. Nuttall), Louisiana Geological Survey (C. Breland), Montana Board of Oil & Gas Conservation (J. Halvorson), New Mexico Institute of Mining & Technology (M. Cather), Ohio Geological Survey (J. McDonald, L. Wickstrom), Oklahoma Geological Survey (B. Cardott), Pennsylvania Dept. of Conservation & Natural Resources (T. Markowski), The Exploration Company (R. Scott), Utah Division of Oil, Gas & Mining (D. Jarvis), United States Geological Survey (R. Milici, P. Warwick), Virginia Division of Gas & Oil (B. Wilson, G. Janson), Washington State Dept. of Natural Resources (M.A. Shawver), Wyoming Oil & Gas Conservation Commission (G. Strong), West Virginia Geological & Economic Survey (L. Avary)
Coal BasinsUSGS (J. Tully, R. Milici, J. East, Prof. Papers 1625 A-D, OFR 99-376), AK DNR (J. Clough, R. Merritt, and C. Hawley, W. Ehm. P. Peapples) Coal Mines EPA (C. Talkington), MSHA (E. Sherer-Hubert), EIA (W. Watson, D. Morehouse), USGS (T. Rohrbacher), Colorado Geological Survey (C. Carroll), Illinois State Geological Survey (S. Elrick), Indiana Geological Survey (B. Meyer), Kentucky Geological Survey, Montana Bureau of Mines & Geology, New Mexico Bureau of Geology and Mineral Resources (G. Hoffman), Oklahoma Dept. of Mines (D. Shults), Utah Division of Oil, Gas & Mining (J. Morse), West Virginia Office of Miners' Health (D. Kessler), Wyoming BLM (D. McGarry)
AcknowledgmentsThanks for advice and support from D. Morehouse, G. Long, P. Chapman, J. Tower and J. Wood (EIA); L. Luo and J. Perrin (Z, Inc.), R. Briggs and F. Qiu (University of Texas at Dallas). Special thanks to my wife, Gayle Haraguchi, for her support and patience. |


