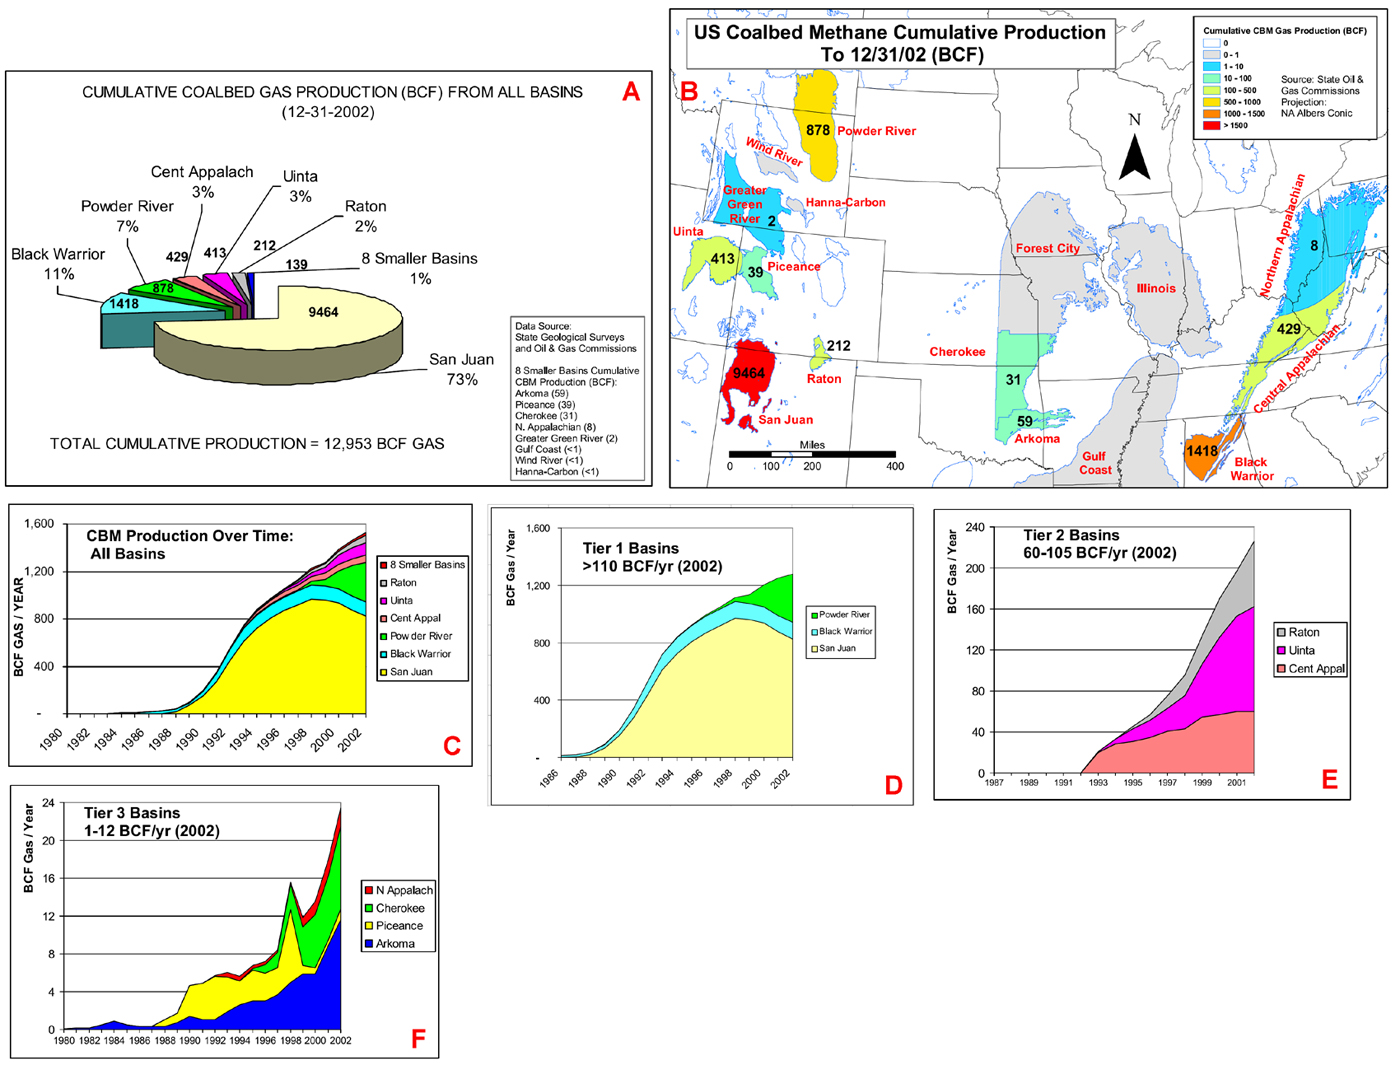
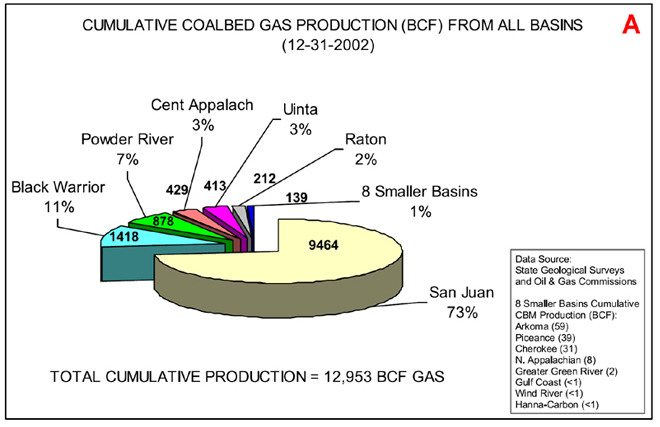
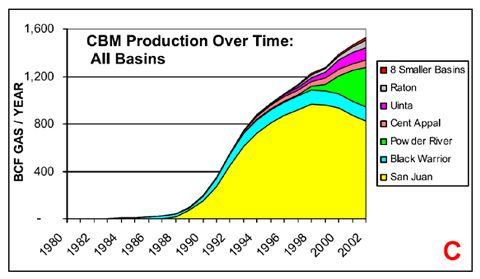
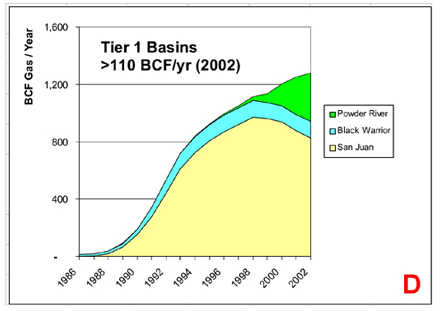
Figure 7. CBM Production. Click on image for overall enlargement.
A.
Pie chart of the cumulative coalbed gas production from all US
basins, exclusive of Alaska, through 2002.
B. Map (chlorepleth) of cumulative coalbed gas production,
according to basin (exclusive of Alaska).
C. Plot of annual cumulative coalbed methane production.
D. Plot of annual coalbed methane production from Tier 1 basins
(Powder River, Black Warrior, and San Juan).
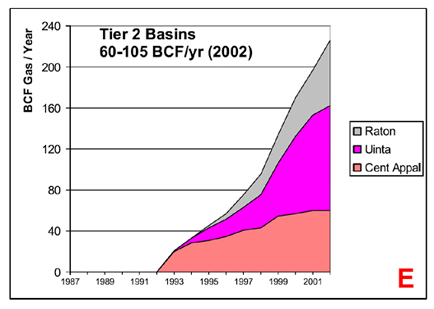
E. Plot of annual coalbed methane production from Tier 2 basins
(Raton, Uinta, and Central Appalachian).
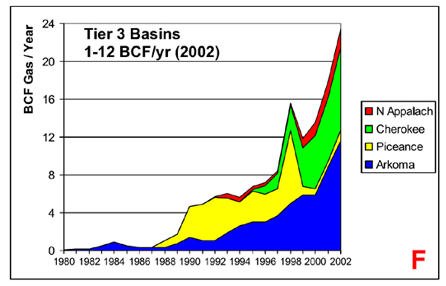
F. Plot of annual coalbed methane production from Tier 3 basins
(Northern Appalachian, Cherokee, Piceance, and Arkoma).