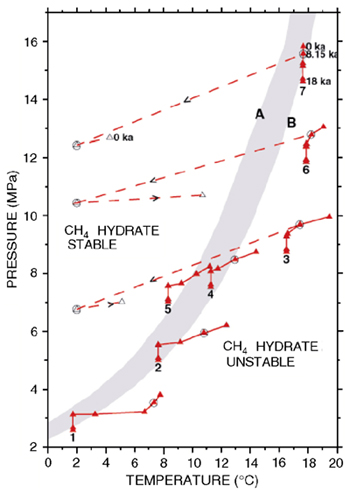
Figure 3. Trajectories (from last Ice Age, at 18ka, to the present) of seven sub-seafloor points (See Figure 2 for locations) in Temperature and Pressure space, in relation to boundary of methane hydrate stability. Circled points correspond to 8.15ka, time of Storegga slide. Trajectory branches for points within the slide area and covered by slide debris are shown dashed. Because the phase boundary depends on pore water salinity and admixed higher hydrocarbons, it is shown here as a band. The left edge (A) reflects pore water with the salinity of seawater, while the right edge (B) reflects fresh water with 2% ethane.