|
Figure and Table Captions
Return to top.
Data
acquisition consists of an electrical transmitter (Tx) with magnetometer
receivers (Rx) positioned up to 1.5 miles away. Data are sampled between
the transmitter and receiver (Figure 2). The system records the magnetic
induction caused by electrical signals put through a transmitter on the
ground. The input signal and the earth's magnetic response are both
monitored. Computer processing outputs a conductivity log. Accuracy
depends on the thickness-depth ratio, conductivity contrast, and
background  noise noise . .
Some of
the scientific theory has been published in the United States and
Russia. Successful lab and field tests have been independently
conducted. Testing was done in the shallow Cretaceous Niobrara chalks in
the D-J Basin in eastern Colorado, where:
-
Niobrara gas pay varies
from 25 to 70 feet thick.
-
Porosity is 30-40 percent.
-
Formation permeability is
below a millidarcy.
-
Productive wells need
fracture stimulation.
Niobrara
gas fields are structurally-trapped accumulations. Typical gas wells
produce under 500 MCFPD and have reserves averaging from 100-700 MMCF up
to 2 BCF per well. Formation resistivity is 1-2 ohm-m in wet wells and
4-25 ohm-m in producers.
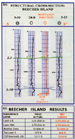
Beecher
Island Field covers 27 square miles; production is at 1,400 feet, with
200 feet of structural closure. One of the EM tests was done on the
field's crest. The results (Figure 3) show that when the Niobrara is gas
saturated, EM can measure the depth and resistivity of the pay zone. was done on the
field's crest. The results (Figure 3) show that when the Niobrara is gas
saturated, EM can measure the depth and resistivity of the pay zone.
A survey
also was conducted over the structural lead shown in red (Figure 4) at a
depth of 1800 feet. The survey resulted in 29 "virtual" logs being added
to existing subsurface data to produce the EM-derived structure map. The
lead was verified to the northwest, but it proved to be substantially
smaller than expected. EM-verified a structure that was too small to
drill because of remote pipeline access. In this case, EM saved
thousands of acreage, drilling, completion, and other exploration
dollars that otherwise would have been spent on an uneconomic venture.
Reconnaissance work can be done as well as prospect evaluation, because
the method is fast, adaptable, and relatively inexpensive.
-
Because lateral facies
boundaries can cause resistivity changes, the system can be used for
stratigraphic exploration.
-
Reservoir work, such as gas
storage projects, can use EM for field boundary delineation.
Reservoirs like the Eagle Sandstone in Montana, shallow gas in
California and the Trenton, Clinton, and other shallow formations in
the eastern United States can be mapped.
-
EM can map shallow coal
beds because they have strong resistivity contrast with surrounding
rocks.
-
Local conductivity
variations in coal beds also can be mapped.
-
Other areas that can
benefit are minerals and groundwater exploration, archeological, and
environmental work.
The
current EM system's depth limit is about 2500 feet, but signal
penetration is area-dependent, and some areas allow deeper penetration.
Advanced system designs will soon permit recording well below 5000 feet.
A
conductivity contrast is necessary for the tool to work. In the examples
presented, productive Niobrara generally has a 100 percent or greater
contrast, but EM detects much lower contrasts. Mineralized zones are
identifiable because they generally show very high contrasts.
Effective
analysis of EM profiles requires calibration to known subsurface
conditions. Cultural problems affecting use are electric transmission
lines, pumps, pipelines with cathodic protection, and high traffic
areas.
EM surveys
are highly efficient -- analysis is completed in a few days, allowing
for great acquisition versatility. Because of this, the crew can be
redirected to sample an anomaly on a tighter grid before moving. EM also
is easy on the environment, lowering permitting costs due to negligible
surface disturbance.
The main
advantage of an EM survey is its low cost compared to 3-D seismic
designed for high frequency at shallow depths. This is especially true
when the cost of three-component data necessary for subsurface fluid
detection is added to the basic 3-D cost.
Reference
Wright, D.A., Ziolkowski, A., and
Hobbs, B.A., 2001, Hydrocarbon detection with a multi-channel transient
electromagnetic survey (Expanded Abstracts): 71st SEG Meeting, 9-14
September, San Antonio, p 1435-1438.
Return to top.
|