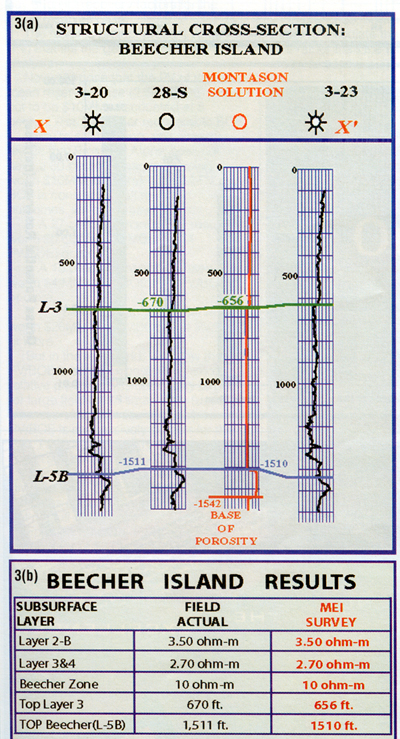
Figure 3. Comparison of Niobrara resistivity logs to an EM profile measured over Beecher Island Field. The table (3(b)) shows a comparison of the EM measurements with actual well measurements.
Figure 3. Comparison of Niobrara resistivity logs to an EM profile measured over Beecher Island Field. The table (3(b)) shows a comparison of the EM measurements with actual well measurements.