![]() Click
to view article in PDF format.
Click
to view article in PDF format.
Late Neogene Paleobathymetry, Relative Sea Level, and Basin-Margin Subsidence, Northwest San Joaquin Basin, California*
By
J. Richard Bowersox1
Search and Discovery Article #30029 (2004)
*Adapted from extended abstract for presentation at AAPG Annual Convention, Dallas Texas, April 18-21, 2004
1University of South Florida, Tampa, FL ([email protected])
Abstract
The northwestern San Joaquin Basin remained near sea level throughout the late Neogene despite lying on a tectonically active basin margin. What may be inferred is that from latest Miocene through Late Pliocene deposition kept pace with basin subsidence. The late Neogene San Joaquin Basin was 175 km long, 100 km wide, and bounded by mountains to the east, south, and west. It connected to the Pacific Ocean at the northwest through a narrow and shallow strait ~13 km wide and <50 m deep. Paleobathymetry determined from benthic foraminifera faunas from the subsurface of southeastern Lost Hills oil field shows water depth in the San Joaquin Basin >200 m in the latest Miocene, becoming progressively shallower to ~125 m by middle Pliocene, then (by middle Late Pliocene) to ~25 m, where it remained until the Pacific Ocean connection was tectonically closed at 2.2 Ma. I constructed a relative sea level curve for the late Neogene northwest San Joaquin Basin by assigning appropriate water depths to the succession of latest Miocene through latest Pliocene molluscan communities based on their similarity to published modern communities in San Francisco Bay, then smoothed it to remove most tectonic “noise.” When compared to the 3rd order Gulf of Mexico eustatic curve, this relative sealevel curve shows very close correlation. Using the relative sea level curve to refine stratigraphic timing, I developed a time-thickness diagram indicative of relative basin-margin subsidence. Latest Miocene basin-margin subsidence averaged ~25 cm/kyr, then accelerated to a peak of 140 cm/kyr in the middle Early Pliocene coincident with Coast Range uplift. By Late Pliocene subsidence slowed to 11 cm/kyr, then again peaked in latest Pliocene at 86 cm/kyr immediately preceding closure of the connection to the Pacific Ocean.
|
|
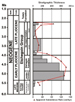
Late Neogene Paleogeography and Paleobathymetry of the San Joaquin BasinBy the late Neogene the San Joaquin Basin had reached its present overall geographic configuration (Figure 1) and was bounded to the east by the southern Sierra Nevada and to the south and west by the San Emigdio and southern Coast Ranges (see Reid, 1995, fig. 11). Incision of the San Joaquin River began at ~10 Ma (Wakabayashi and Sawyer, 2001) while the age of the base of the Kern River Formation is estimated at 8 Ma (Graham et al, 1988). To the northeast the basin was filled by fluvial deposits of the late Neogene San Joaquin and Kings rivers, and the substantial fan-delta Kern River Formation was deposited by the Kern River on the southeast basin margin (see Foss, 1972, Pliocene transgressive phase map). This suggests that all major southern Sierra Nevada Rivers were draining into the San Joaquin Basin by the late Neogene (Figure 1). To the northwest the San Joaquin Basin opened to the Pacific Ocean through the shallow and narrow Priest Valley Strait (Loomis, 1990). Uplift of the southern Sierra Nevada reached 2.5 km by 57 Ma, then stopped until ~ 5 Ma (Wakabayashi and Sawyer, 2001). Renewed uplift elevated the southern Sierra Nevada above 3.5 km by 3.0 Ma (Graham et al., 1988). Uplift of the Temblor Range and southern Coast Ranges began their current phase by 5.4 Ma (Miller, 1999). Based on fault-normal convergence of the Pacific and Sierran plates across the San Andreas fault transform boundary, Argus and Gordon (2001) demonstrated that uplift of the Coast and San Emigdio Ranges probably commenced by 6.6 Ma or 8 Ma. The late Neogene San Joaquin Basin inland sea was 175 km long, 100 km wide, and connected to the Pacific Ocean at the northwest through a narrow and shallow strait (Figure 1) ~13 km wide and <50 m deep (Loomis, 1990). Paleobathymetry determined from benthic foraminifera faunas from the subsurface of southeastern Lost Hills oil field (Figure 2), ~12 km southwest of the basin axis, shows water depth in the San Joaquin Basin >200 m in the latest Miocene, becoming progressively shallower to ~125 m by middle Pliocene, then (by middle Late Pliocene) to ~25 m, where it remained until the Pacific Ocean connection was tectonically closed at 2.2 Ma. Abrupt decrease in paleobathymetry at ~4 Ma may be related to rapid sediment deposition in the basin associated with increased uplift of the Coast Ranges (Loomis, 1990), coincident with eustatic sea level fall (Figure 3), and the slowing of subsidence on the basin margin (Figure 4) leading to sediment bypass.
Northwest San Joaquin Basin Relative Sea Level and Basin-Margin SubsidenceThe thick section of the Etchegoin Group exposed on the northwest margin of the San Joaquin Basin has been measured and described in several studies (Arnold and Anderson, 1910; Adegoke, 1969; Stanton and Dodd, 1976; Loomis, 1990). Approximately 2500 m of late Neogene Santa Margarita through San Joaquin Formations strata are exposed from Coalinga to the Kreyenhagen and Kettleman Hills. Sedimentary structures and megafossil faunas studied in outcrop over an area stretching ~130 km from Priest Valley, Fresno County, to the Bacon Hills, Kern County, suggest that the northwestern San Joaquin Basin remained near sea level throughout the late Neogene despite lying on a tectonically active basin margin. What may be inferred is that from latest Miocene through Late Pliocene deposition kept pace with basin subsidence. To construct the northwest San Joaquin Basin relative sealevel curve (Figure 3), I first assigned an appropriate water depths from bathymetry (1.5 - 25 m) to the molluscan communities recognized by Stanton and Dodd (1970) in San Francisco Bay and Etchegoin Group faunas from the Kettleman Hills. The upper Etchegoin through San Joaquin Formations portion of the northwest San Joaquin Basin relative sealevel curve was constructed by applying the interpreted water depths above to the sequence of molluscan communities found in the Kettleman Hills by Stanton and Dodd (1970). I then applied this technique to faunas of the Jacalitos through middle Etchegoin Formations from the Kreyenhagen Hills (Adegoke, 1969; Loomis, 1990) and Santa Margarita Formation from Coalinga (Adegoke, 1969; Cote, 1991). The curve was then smoothed to remove most tectonic “noise” through the Jacalitos and Etchegoin Formations and then correlated to the Gulf of Mexico eustatic curve (Figure 3). Rapid flooding of the San Joaquin Basin during the late Neogene, characteristic of a relatively shallow silled basin, is suggested by the flat-based highstand sections of the relative sealevel curve immediately following lowstands. Using Figure 3 to refine the timing of late Neogene formation boundaries, I was able to construct a time-thickness diagram for the northwest San Joaquin Basin and calculate the basin-margin subsidence rate (Figure 4). Latest Miocene basin-margin subsidence averaged ~25 cm/kyr, then accelerated to a peak of 140 cm/kyr in the middle Early Pliocene coincident with increasing Coast Range uplift. By Late Pliocene subsidence slowed to 11 cm/kyr, then again peaked in latest Pliocene at 86 cm/kyr immediately preceding closure of the Priest Valley Strait and the connection of the San Joaquin Basin to the Pacific Ocean.
DiscussionComparison of basinal paleobathymetry (Figure 2) and basin-margin subsidence (Figure 4) clarifies the basin-filling history. The steady reduction in subsidence at the basin margin during the Early Pliocene beginning ~4.6 Ma and consistently low rate of subsidence during the Late Pliocene reduced the available accommodation space on the basin margin. The abrupt decrease in basinal paleobathymetry at ~4 Ma (Figure 2) corresponds to a fivefold reduction in subsidence rate at the northwestern basin margin at the same time (Figure 4). When accommodation space on the western basin margin was filled, the additional sediment supply passed on towards the basin center. Eustatic lowstands in the Late Pliocene led to deposition of thick sands out in the basin With the prograding deltas on the eastern margin included in the overall depositional picture, sediment supply to the basin was sufficient to fill the San Joaquin Basin to a very shallow depth, to ~25 m at southeastern Lost Hills oil field and probably not much more at the basin center, by latest Pliocene.
ReferencesAdegoke, O.S., 1969, Stratigraphy and paleontology of the marine Neogene formations of the Coalinga region, California: University of California, Publications in Geological Sciences, v. 80, 241 p., 13 pl. Argus, D.F., and Gordon, R.G., 2001, Present tectonic motion across the Coast Ranges and San Andreas fault system in central California: GSA Bulletin, v. 113, p. 1580-1592. Arnold, R., and Anderson, R., 1910, Geology and oil resources of the Coalinga district, Fresno and Kings counties, California: U.S. Geological Survey Bulletin 398, 354 p. Bowersox, J.R., 2003, Pliocene age of the Etchegoin Group, San Joaquin Basin, California [abstract]: AAPG Pacific Section, and SPE Western Region, Conference Program and Abstracts, p. 55. Cote, R.M., 1991, Paleontology of the “Santa Margarita” Formation on the Coalinga anticline, Fresno County, California [MS thesis]: Northridge, California, California State University, Northridge, 259 p., 8 pl. Foss, C.D., 1972, A preliminary sketch of the San Joaquin Valley stratigraphic framework, in Rennie, E.W., ed., Guidebook: Geology and Oil Fields of the West Side Central San Joaquin Valley: AAPG, SEG, and SEPM Pacific Sections, p. 40-50. Graham, S.A., Carroll, A.R., and Miller, G.E., 1988,Kern River Formation as a recorder of uplift and glaciation of the southern Sierra Nevada, in Graham, S.A., and Olson, H.C., Studies of the Geology of the San Joaquin Basin: Pacific Section, SEPM, Book 60, p. 319-332. Harris, W.M., 1987, Organism interactions and their environmental significance, as exemplified by the Pliocene-Pleistocene fauna of the Kettleman Hills and Humboldt basin, California [Ph.D. thesis]: College Station, Texas A&M University, 254 p. Loomis, K.B., 1990, Late Neogene depositional history and paleoenvironments of the westcentral San Joaquin Basin, California [Ph.D. thesis]: Stanford, California, Stanford University, 594 p. Maruyama, T., 2000, Middle Miocene to Pleistocene diatom stratigraphy of Leg 167, in Lyle, M., Koizumi, I., Richter, C., and Moore, T.C., Jr., eds., Proceedings of the Ocean Drilling Program, Scientific Results, v. 167: College Station, Texas, Ocean Drilling Program, p. 63-110. Miller, D.D., 1999, Sequence stratigraphy and controls on deposition of the upper Cenozoic Tulare Formation, San Joaquin Valley, California [Ph.D. thesis]: Stanford, California, Stanford University, 179 p. Reid, S.A., 1995, Miocene and Pliocene depositional systems of the southern San Joaquin Basin and formation of sandstone reservoirs in the Elk Hills area, California, in Fritsche, E.A., ed., Cenozoic Paleogeography of the Western United States - II: SEPM Pacific Section, Book 75, p. 131-150. Stanton, R.J., Jr., and Dodd, J.R., 1970, Paleoecologic techniques – comparison of faunal and geochemical analyses of Pliocene paleoenvironment, Kettleman Hills, California: Journal of Paleontology, v. 44, p. 1092-1121. Stanton, R.J., and Dodd, 1976, Pliocene biostratigraphy and depositional environment of the Jacalitos Canyon area, California, in Fritsche, E.A., Ter Best, H., and Wornardt, W.W., eds., The Neogene Symposium: Pacific Section, SEPM, p. 85-94. Wakabayashi, J., and Sawyer, T.L., 2001, Stream incision, tectonics, uplift, and evolution of topography of the Sierra Nevada, California: Journal of Geology, v.109, p.539-562. Wornardt, W.W., and Vail, P.R., 1991, Revision of the Plio-Pleistocene cycles and their application to sequence stratigraphy and shelf and slope sediments in the Gulf of Mexico: Transactions GCAGS, v. 41, p. 719-744. Wornardt, W.W., Shaffer, B., and Vail, P.R., 2001, Revision of the Late Miocene, Pliocene, and Pleistocene sequence cycles [abstract]: AAPG Bulletin, v. 85, p. 1710.
|