|
Figure Captions
 Figure 1. (Left) Bossier study area on map of
East Texas Basin showing regional tectonic features (after Montgomery
and Karlewicz, 2001). (Right) Isopach map of Bossier Formation, in seven
county area and location of Well Log Section 6-6’ (Figure
5).
Arrows
show interpreted primary route of sand feeder systems. (0–1,000' isopach—Shelf;
1,000–1,500' isopach—Slope; >1,500' isopach—Basin Floor). Figure 1. (Left) Bossier study area on map of
East Texas Basin showing regional tectonic features (after Montgomery
and Karlewicz, 2001). (Right) Isopach map of Bossier Formation, in seven
county area and location of Well Log Section 6-6’ (Figure
5).
Arrows
show interpreted primary route of sand feeder systems. (0–1,000' isopach—Shelf;
1,000–1,500' isopach—Slope; >1,500' isopach—Basin Floor).
 Figure 2. Global context of Bossier Formation
(~ 150 Ma) (from Scotese, 2000;
www.scotese.com). Figure 2. Global context of Bossier Formation
(~ 150 Ma) (from Scotese, 2000;
www.scotese.com).
 Figure 3. Regional setting for Bossier
facies,
as shown by a map of Figure 3. Regional setting for Bossier
facies,
as shown by a map of  depositional depositional systems early Cotton Valley
(Tithonian)
(from Ewing, 2001). systems early Cotton Valley
(Tithonian)
(from Ewing, 2001).
 Figure 4. Stratigraphy of Bossier Formation: Two approaches. (Left)
Columnar section showing intertonguing interpretation of upper Bossier
contact (after Montgomery and Karlewicz, 2001). (Right) Sequence
stratigraphic model for Bossier Formation (from Williams and Mitchum,
1997).
Figure 4. Stratigraphy of Bossier Formation: Two approaches. (Left)
Columnar section showing intertonguing interpretation of upper Bossier
contact (after Montgomery and Karlewicz, 2001). (Right) Sequence
stratigraphic model for Bossier Formation (from Williams and Mitchum,
1997).
 Figure 5. NW-SE dip-line Well Log
Cross-Section 6–6’, Bossier Formation, Freestone and Leon Counties,
Texas (Figure 1
(Right) for location). Division of the Bossier
into lower and upper units by recognizing sequence boundaries SB-1,
SB-2, and SB-3. Dark Reddish Orange--basin floor fan;
Green--levee-channel fan complex; Yellow--deltas. Figure 5. NW-SE dip-line Well Log
Cross-Section 6–6’, Bossier Formation, Freestone and Leon Counties,
Texas (Figure 1
(Right) for location). Division of the Bossier
into lower and upper units by recognizing sequence boundaries SB-1,
SB-2, and SB-3. Dark Reddish Orange--basin floor fan;
Green--levee-channel fan complex; Yellow--deltas.
 Figure 6. Interpreted, updip part of NW-SE seismic dip line. Segpolar display (published with
permission of Seismic Exchange, Inc). Division of Bossier Formation is
shown, along with shelf edge, salt features, and seismic stratigraphic
features.
Figure 6. Interpreted, updip part of NW-SE seismic dip line. Segpolar display (published with
permission of Seismic Exchange, Inc). Division of Bossier Formation is
shown, along with shelf edge, salt features, and seismic stratigraphic
features.
 Figure 7. Interpreted, downdip part of NW-SE seismic dip line. Segpolar display
(published with permission of Seismic Exchange, Inc). Division of
Bossier Formation is shown, along with seismic stratigraphic features.
Figure 7. Interpreted, downdip part of NW-SE seismic dip line. Segpolar display
(published with permission of Seismic Exchange, Inc). Division of
Bossier Formation is shown, along with seismic stratigraphic features.
 Figure 8. Interpreted seismic strike line, oriented SW to NE. Segpolar display
(published with permission
of Seismic Exchange, Inc),
showing seismic stratigraphic features.
Figure 8. Interpreted seismic strike line, oriented SW to NE. Segpolar display
(published with permission
of Seismic Exchange, Inc),
showing seismic stratigraphic features.
 Figure 9. Bossier Formation sequence
stratigraphic model, East Texas Basin, developed by analysis of seismic
and well-log data. Figure 9. Bossier Formation sequence
stratigraphic model, East Texas Basin, developed by analysis of seismic
and well-log data.
 Figure 10. Map of depositional systems of
upper Bossier Formation (SB-2 to SB-3), East Texas Basin, Texas (after
Ewing, 2001, Figure 3). Orange (sandy deltaic or fluvial), yellow
(sand-rich shorelines), light blue (carbonate ramps), gray (basinal
shales), olive (submarine fan sands), light blue green line (updip limit
of Jurassic). Figure 10. Map of depositional systems of
upper Bossier Formation (SB-2 to SB-3), East Texas Basin, Texas (after
Ewing, 2001, Figure 3). Orange (sandy deltaic or fluvial), yellow
(sand-rich shorelines), light blue (carbonate ramps), gray (basinal
shales), olive (submarine fan sands), light blue green line (updip limit
of Jurassic).
 Figure 11. Map of seven county area, East
Texas Basin, showing depositional units defining prospective plays in
the Bossier Formation and location of well log cross-sections in red)
used in this study. Figure 11. Map of seven county area, East
Texas Basin, showing depositional units defining prospective plays in
the Bossier Formation and location of well log cross-sections in red)
used in this study.
 Figure 12. Burial history and tectonic
subsidence curves, depocenter, East Texas Basin, Texas. Curve derived
from stratigraphic sonic log markers at southeast end of dip-oriented
seismic line (Figure 7). Figure 12. Burial history and tectonic
subsidence curves, depocenter, East Texas Basin, Texas. Curve derived
from stratigraphic sonic log markers at southeast end of dip-oriented
seismic line (Figure 7).
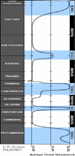 Figure 13. Average global temperature during
the Phanerozoic and part of the Precambrian, with one of the changes
from warm to cool during the latter part of the Jurassic (from Scotese,
2000;
www.scotese.com) Figure 13. Average global temperature during
the Phanerozoic and part of the Precambrian, with one of the changes
from warm to cool during the latter part of the Jurassic (from Scotese,
2000;
www.scotese.com)
 Figure 14.
Conventional discovery curve (idealized simple creaming curve of
Snedden et al., 2003). Figure 14.
Conventional discovery curve (idealized simple creaming curve of
Snedden et al., 2003).
 Figure 15. Creaming curve and sequence
stratigraphy (after Snedden et al., 2003). Figure 15. Creaming curve and sequence
stratigraphy (after Snedden et al., 2003).
 Figure 16. East Texas Bossier play, as of
2002, showing fields, discovery wells, pipeline, and Anadarko Petroleum
Corporation acreage (from J.N. Seitz, Banc of America, Security Energy
and Power Conference, with permission of Anadarko Petroleum
Corporation). Figure 16. East Texas Bossier play, as of
2002, showing fields, discovery wells, pipeline, and Anadarko Petroleum
Corporation acreage (from J.N. Seitz, Banc of America, Security Energy
and Power Conference, with permission of Anadarko Petroleum
Corporation).
1). Establish sequence stratigraphic
framework.
2). Identify major sand facies.
3). Map sand facies and identify potential
exploration fairways.
4). Tie stratigraphy and facies to basin
history.
• Detailed interpretation of well-log
cross-sections (13 lines, 151 wells)
• Detailed analysis of 13 seismic lines (~840
Mi.)
• Identify all major sequence boundaries and
systems tracts (methods of Mitchum et al., 1995; Van Wagoner et
al.,1990).
• Map log facies and seismic facies.
• Identify best prospective fairways.
Characteristics of time during deposition of
Bossier Formation include:
• Global high stand of sea level (Kimmeridgian)
• Time of generation of major source beds
• Tropical/humid paleoclimate
• Deep weathering - shale-dominated system;
Bossier - Low net/gross sand
The Bossier Formation is divided into two
sequences by a mid-Bossier sequence boundary (SB-2) (Figures
5, 6, 7, 8,
and 9).. The base and the top of the Bossier are also delineated by
sequence boundaries (SB-1 and SB-3, respectively).
The lower
Bossier Formation (below SB-2) formed during rapid subsidence when mud
was the dominant sediment deposited in the basin. On the other hand, the
upper Bossier was deposited after a drop of seal level. The basin then
was characterized by areas of deep water fan sedimentation as well as
shelf to shelf-edge, stacked deltas, which together represent the
fairways of the Bossier play (Figures 9, 10, and
11).
• Bossier was deposited during time of rapid
mechanical subsidence.
• Deposition could not keep up with subsidence
until sea level dropped (SB-2).
• PGC (prograding complex) formed during time
when deposition kept up with or exceeded subsidence rate.
• SB-2 may signify possible climate change
favoring influx of sand (Figure 13).
General
In mud-dominated systems, a drop in sea level
will extend fluvial systems basinward. An associated change in climate
is the driver that disperses sand into such settings.
The exploration potential of this finding
opens up many new sandy reservoir possibilities in mud-dominated
systems.
Within the shelf region (mostly in Freestone
County), the upper Bossier Formation is characterized by sandy deltaic
units that organized as combined progradation, aggradational, stacked
units composing a major gas producing fairway system.
Within the slope, well developed basin floor
fans, slope fans, and channel/levee complexes define a potential
deep-water gas-producing fairway system.
In the East Texas basin, deposition of the
Bossier occurred during a time of relatively rapid fault-controlled
subsidence, modified by salt movement. These developments, when combined
with a lowering in sea level and moderate climate change resulted in the
distribution of sand reservoirs in the shale-prone Bossier system.
Future of
Bossier Play?
(Figures 14 and
15)
Some of the factors in determining the future
of the Bossier play are:
• Gas price: > $4.00 to $4.50
• Acreage Costs
• Engineering at depths > 19,000 ft.
• Consideration of creaming curves (Snedden et
al., 2003) (Figures 14 and 15), in view of the potential fairway of
deep-water Bossier reservoirs.
Status of
Bossier Play in 2002
(Figure 16)
Figure 16
shows the occurrence of major gas fields of the Bossier Play in the East
Texas basin, as of 2002. Our analysis shows that the Nan Su Gail, Dowdy
Ranch, Mimms Creek and Dew Fields occur within Highstand Systems Tracts,
whereas the Bear Grass field occurs in a Transgressive Systems Tract.
Bald Prairie field represents a Lowstand Systems Tract field.
Application of the sequence stratigraphic creaming curve
(Figure 15)
suggests that the current status of the
Bossier play is presently at the nick point between the Transgressive
Systems Tract and the Lowstand Systems Tract. Likely, the Bossier Play
has an estimated four to five years left.
ConocoPhillips Company (Phillips Petroleum
Company at the time of this study [David R. Fox, Scott McCullough, Lisa
Ashabranner, Campbell Huntington]).
John Havens, Seismic Exchange Inc.
Doug Barnhouse, G.A.S Unlimited.
C.R. Scotese (www.scotese.com).
Robert W. Stancil, Anadarko Petroleum
Corporation.
Norman C. Rosen, GCSSEPM Foundation.
Selected
Bibliography
Anderson, E.G., 1979, Basic
Mesozoic study in Louisiana, the northern, and the Gulf Basin province:
Louisiana Geol. Survey Folio 3, 58 p.
Ewing, T.E., 2001, Review of
Late Jurassic Depositional Systems and Potential Hydrocarbon plays,
Northern Gulf of Mexico: Gulf Coast Assoc. Geol. Soc. Trans., v. 51, p.
85–96.
Forgotson, J.M., Jr., 1954,
Regional stratigraphic analysis of Cotton Valley Group of Upper Gulf
Coastal Plain: AAPG Bull., v. 38, p. 2476–2499.
Galloway, W.W., and D.K.,
Hobday,1996, Terrigenous clastic depositional systems: New York,
Springer-Verlag, 489p.
Garner, H.F., 1959,
Stratigraphic-sedimentary significance of contemporary climate and
relief in four regions of the Andes Mountains: Geol. Soc. America Bull.,
v. 70, p.1327–1368.
Haq, B. U., J. Hardenbol, and
P.R Vail, 1987, Chronology of fluctuating sea levels since the Triassic:
Science, v. 235, p. 1156–1167.
Jackson, M.P.A., and S.J. Seni,
1983, Geometry and evolution of the salt structures in a marginal rift
basin of the Gulf of Mexico, east Texas: Geology, v. 11, p. 131–135.
Klein, G.D., and K.R. Chaivre,
2002, Sequence and seismic stratigraphy of the Bossier Formation (Tithonian),
western East Texas Basin: GCAGS Transactions, v. 52, p. 551-561.
Mann, C.J., and W.A. Thomas,
1964, Cotton valley group (Jurassic) nomenclature, Louisiana and
Arkansas: Gulf Coast Assoc. Geol. Soc. Trans., v. 14, p. 143–152.
Mitchum, R.M., J.B. Sangree, P.R. Vail, and W.W. Wornardt,
1995, Recognizing sequences and systems tracts from well logs, seismic
data, and biostratigraphy: examples from the Late Cenozoic of the Gulf
of Mexico: in Posamentier, H.A., and Weimer, P., eds.,
Siliciclastic Sequence Stratigraphy: AAPG Mem. 58, p. 163–197.
Montgomery, S.L., and R. Karlewicz, 2001, Bossier play
has room to grow: Oil and Gas Jour., January 29, 2001 issue, p. 36–43.
Presley, M.W., and C.H. Reed, 1984, Jurassic exploration
trends of East Texas: in Presley, M.W., ed., The Jurassic of East
Texas: East Texas Geol. Soc. p. 11–22.
Scotese, C.R., 2000, Paleomap Project: Earth History—Late
Jurassic: C.R. Scotese Publications:
www.scotese.com,
http://www.scotese.com/late1.htm)
Scotese, C.R., 2002, Climate History (Chart): C.R.
Scotese Publications:
www.scotese.com;
http://www.scotese.com/climate history.htm (04/20/02).
Snedden, J.W., J.F. Sarg, and X. Ying, 2003, Exploration
play analysis from a sequence stratigraphic perspective: Search and
Discovery Article #40079 (http://www.searchanddiscovery.net/documents/snedden/index.htm).
Stevens, K.M., J.B. Wagner., T.D. Sheffield, L.L. Brooks,
P. Zippi, M.A. Dablain, B. Brown, and R. Offenberger, 2002, Integrated
analysis of the Upper Jurassic Bossier deltaic complex, East Texas
(Abstract): Houston Geol. Soc. Bull., v. 44, No. 6, p. 21.
Thomas, W.A., and C.J. Mann, 1964, Late Jurassic
depositional environments, Louisiana and Arkansas: AAPG Bull., v. 50, p.
178–182.
Todd, R.G., and R.M. Mitchum Jr., 1977, Seismic
stratigraphy and global change of sea level, Part 8: Identification of
Upper Triassic, Jurassic, and Lower Cretaceous Seismic Sequences in Gulf
of Mexico and offshore West Africa: in Payton, C. E., ed.,
Seismic Stratigraphy—applications to hydrocarbon exploration: AAPG Mem.
26, p. 145–164.
Ulmishek, G.F., and H.D. Klemme, 1990, Depositional
controls, distribution, and effectiveness of world’s petroleum source
rocks: U.S. Geological Survey Bull. 1931, 59 p.
Van Wagoner, J.C., R.M. Mitchum, K.M. Campion, and V.D.
Ramanian, V.D., 1990, Siliciclastic sequence stratigraphy in well logs,
cores, and outcrops: concepts for high-resolution correlation of time
and facies: AAPG Methods in Exploration Series, No. 7, 55 p.
Williams, R.A, M.C. Robinson, E.G. Fernandez, and R.M.
Mitchum, 2001, Cotton Valley/Bossier of East Texas: sequence
stratigraphy creates depositional history: Gulf Coast Assoc. Geol. Soc.
Trans., v. 51, p. 379–388.
Williams, R, and R.M. Mitchum, 1997, Sequence -stratigraphic
controls on Cotton Valley tight gas sandstones, Carthage Field, Panola
County, Texas: in Shanley, R.A., ed., Shallow marine and
nonmarine reservoirs: GCSSEPM Foundation 18th Ann. Res. Conf.
Proceedings, p. 409–425. -stratigraphic
controls on Cotton Valley tight gas sandstones, Carthage Field, Panola
County, Texas: in Shanley, R.A., ed., Shallow marine and
nonmarine reservoirs: GCSSEPM Foundation 18th Ann. Res. Conf.
Proceedings, p. 409–425.
Return
to top.
|