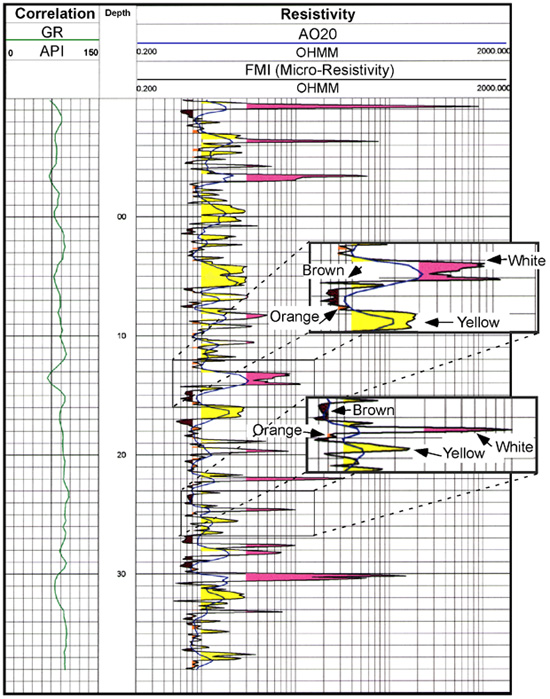
Figure 29. Micro-resistivity log of chromatic distribution in the LR/LC interval. In thicker beds (>1.5 ft) micro-resistivity and high-resolution resistivity display similar patterns. In zones <1.5 ft thick, the micro-resistivity tool provides more accurate measurements by minimizing the effects of adjacent beds. Note that white chromatic zones are shaded pink in this illustration.