![]() Click to view article in PDF format.
Click to view article in PDF format.
Pseudowell Logs for Characterizing Deepwater Fan Reservoirs: The Tanqua Karoo “Laboratory” Model
J. B. Thomas*
Search and Discovery Article #40012 (2001)
Adapted for online presentation from an article entitled “Lithology-Driven Rock Calibration: ‘Laboratory’ Modeling” by the same author in AAPG Memoir 72 / SEPM Special Publication No. 68 (Chapter 27, p. 307-315), Arnold H. Bouma and Charles G. Stone, eds. Memoir is available for sale from AAPG (www.aapg.org) and SEPM (www.sepm.tulsa.net).
Author’s Preface: Deepwater discoveries in offshore West Africa accounted for more than half of the top nine discoveries in 2000. Everywhere deepwater wells require ahead-of-the-drill a more reliable interpretation of reservoir distribution and thickness on the seismic scale, though the resolution required is somewhat beyond the capability of the seismic tool. Therefore, it is incumbent upon the explorationist to use measurements from significantly pertinent outcrop sections to provide data at the scale and with the detail desired and required. The accounts that follows describes research of rocks on outcrop chosen because of their exposures, thicknesses, structural simplicity, and similarities to deepwater-fan reservoirs to serve, after considerable manipulation of the data, as a model for deepwater exploration targets.
*Formerly BP Amoco, Houston, Texas. Currently, Consultant, Tulsa, Oklahoma. email: [email protected].
The critical step necessary to model seismic response for composite deepwater fan sequences is creation of “pseudowell” logs using high-quality outcrop data. The “laboratory” outcrop model can be built to generate “pseudologs” of gamma ray, resistivity, density, and velocity from outcrop descriptions. Synthetic acoustic impedance, reflectivity, and synthetic seismogram curves then are generated on the same scale as measured thicknesses. Extrapolation from outcrop to seismic data is completed by resorting to geophysical data from depositionally similar basins under study, such as the deepwater of the Gulf of Mexico. By varying fluid and rock properties iteratively, it is possible to “forward-model” hydrocarbon presence and its influence on seismic attributes (e.g., AVO) calibrated with rock and log data.
The Permian Skoorsteenberg Formation of the Tanqua Karoo Basin in South Africa is a natural “laboratory” in which to demonstrate how detailed outcrop data can be used to improve rock-calibrated seismic analysis of prospective deepwater fan exploration targets.
Basic Assumptions for Model Building
Petrography/Mineralogy of Fans
Laboratory Measurement of Velocity, Fan 2
The extensive fine-grained fan sequence exposed in the Tanqua Karoo subbasin, South Africa, is an ideal “natural laboratory” in which to demonstrate how lithology-based geophysical models on a seismic wavelet scale can be created. The outcrop-driven approach helps geoscientists prospecting for deepwater fan hydrocarbon traps if limited to a seismic dataset and insufficient local well control for rock property calibration. Apparent amplitude anomalies can then be tested for response due to contrasts in lithology, fluid properties, or their combination.
Lithologically based seismic and log response models can greatly improve the level of understanding of a prospect before drilling. A “normal” sequential work flow to identify a lead seismically is acquisition, processing, migration, and isochron mapping. Depth-converted maps are used to estimate the trap area, thickness, and relationship between hydrocarbon source and trap. Reservoir “quality” estimates such as porosity, permeability, and internal architecture are constrained using well control (e.g., logs, cuttings and/or core, flow tests). Finally, attribute analysis completes “definition” of the prospect. The accuracy of rock/fluid assessment ultimately impacts the exploration risk level assigned to the prospect. Oftentimes that assessment is the last and least analyzed information in prospect risk evaluation. It is this at this point when the rock-driven modeling can have its greatest value.
Basic Assumptions for Model Building
1. Outcrop documentation of the geometry, depositional setting, and internal architecture of reservoir and seal lithologies is accurate.
2. The total stratigraphic thickness of outcrops (e.g., 200 m) exceeds the calculated seismic tuning thickness.
3. “Pseudologs” can be generated based on the ideal log responses for minerals in the outcrops and thicknesses for each lithology; these data are available from logging service companies.
4. Interpretations of depositional conditions (i.e., grain size, basin type) must be similar for the model and the prospect areas.
5. Synthetic seismograms can be created on the same scale as the lithologic sections through acoustic impedance curves and assuming reasonable velocities for each lithology.
6. Fluid substitution data can be added to simulate oil-, gas-, or water-filled reservoir cases.
7. Iterations of rock/fluid combinations can be done on a workstation allowing direct integration of seismic, log, and outcrop models.
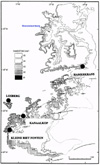
Based on observable lithologic associations, the assumptions outlined allow the explorationist and engineer to build seismic models for different types of reservoirs. More sophisticated forward and backward modeling of reservoir systems calibrated between seismic, log, and rock/fluid data are the result. The Permian Skoorsteenberg Formation in the Tanqua Karoo subbasin of South Africa (Figure 1) serves as a calibration model for deepwater fan reservoir sandstones (Wickens and Bouma, this volume). Similar procedures can be used to develop models for nearshore marine, estuarine, fluviodeltaic, and other nonmarine sandstone reservoirs and carbonates. For any outcrop to be useful in such modeling, the exposure thicker than the length of the seismic wavelet and outcrop gamma-ray measurements must be available for calibration purposes.
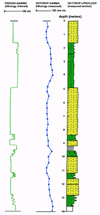
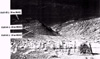
Outcrop studies led by Bouma and Wickens (1991, 1994) and graduate students from Louisiana State University and Stellenbosch University provide detailed documentation of the Permian Ecca Group, Skoorsteenberg Formation stratigraphic succession (Wickens and Bouma, this volume). They have divided the 1300-m-thick sequence into five mappable, fine-grained sand-rich deepwater fan sand bodies separated by interfan shales and siltstones. Bed thicknesses, sedimentary structures, and types of lithologic contacts help confirm the processes forming the depositional sequence; outcrop gamma-ray measurements taken at fixed vertical distances (Figure 2) provides the link to pseudolog creation. Sandstones in the five fans are the result of confined (in-channel) or unconfined (levee-overbank and sheet deposits) flow built out onto a stable basin slope and floor and derived from an igneous-metamorphic upland (Scott et al., this volume). At the Skoorsteenberg locality (Figures 1, 3), a continuous exposure of Fans 3, 4, and 5 are ideal for developing the rock-driven seismic model. Detailed discussion of each fan and the Skoorsteenberg section appear in Wickens (1994), Bouma and Wickens (1994), and Wickens and Bouma (this volume).
The fan sequences are interpreted by Wickens and Bouma (this volume) to have been deposited by processes similar to those forming the Tertiary fans in the deepwater Gulf of Mexico. Fans in the two basins contain sediments with similar grain-size variation, sedimentary structures, and depositional geometry. However, the Pangean source terrain for Skoorsteenberg sediments was probably syndepositionally deformed (Wickens, 1994; Scott, 1997; Scott et al., this volume) and did not involve salt tectonism in developing combination structural-stratigraphic hydrocarbon traps as in the Gulf of Mexico.
Petrography/Mineralogy of Fans
Mineral abundances are reported from thin section, X-ray diffraction, and FTIR (Fourier Transform Infrared Spectrometry) analyses. Fan sandstones of the Tanqua Karoo subbasin are enriched in quartz and albite feldspar compared with the shales. The shales are also feldspathic but relatively enriched in illite. Finely disseminated pyrite and organic material are concentrated in the shales, which are darker than associated sandstones and siltstones.
Table 1 reports mineralogy for shale and sandstone samples collected by Marot (1992), Rozman (1998), and Thomas (this paper) from Fans 1, 2, 3, and 4 of the Skoorsteenberg Formation. Soekor data (Marot, 1992) are normative thin section estimates. Using McBride’s classification scheme (1963), all samples are feldspathic litharenites (10–50% feldspar, >25% lithic fragments, and generally less than 25% quartz). Rozman’s (1998) data from Fan 2 at Losberg are visual estimates but from siltstone and very fine-grained samples, making identification difficult. Quantitative mineralogy determinations by the FTIR technique differ somewhat because polyminerallic rock fragments (e.g., granites, phyllites) are reported by single mineral species. In all cases, the accessory minerals such as calcite and dolomite are interpreted as late-stage replacement or cements and therefore are not indicative of the sediment provenance. Original pore space has been reduced by burial compaction or formation of quartz and feldspar overgrowths during pressure solution or burial.
Assuming that shales are relatively higher in radiogenic illite, gamma-ray scintillation counts at the outcrop face should reflect changes in mineralogy and, therefore, lithology. It is also interpreted that intrastratal solution removal of chemically unstable minerals such as feldspars from the shales has occurred less completely than in the sandstones because of lower initial permeability in the shales. If the shales described in outcrop contain both illite and radiogenic feldspars, they will be assumed to respond as a shale on a gamma-ray curve.
Comparison work between Rozman (1998, this volume) and Thomas (this paper) shows that independently measured outcrop gamma count data compare very favorably with assumed responses (Figure 2). The outcrop gamma and “pseudo/gamma” logs for Fan 2 differ in character because the field data were measured at equal spacings up the outcrop and the other curve changes abruptly at the lithology boundaries as shown. Numerous other scintillometer surveys completed across other Tanqua Karoo outcrops (e.g., Rozman, 1998) show the same variations in natural gamma ray counts corresponding to lithology variations. The “pseudo-gamma” curves were constructed assuming the dominant mineral yielding radioactivity count was illite (contains radiogenic potassium isotope K40). Therefore, shales are high in gamma-ray count, sandstones low, and siltstones intermediate reflecting differences in the illite abundance.
“Pseudodensity curves” were constructed assuming quartz and feldspars with grain densities of about 2.65 g/c3 dominate the sandstones. Shale densities are greater than that because of the more dense clays (e.g., illite at 2.72 g/c3) and pyrite. Siltstones have grain densities intermediate between the two (e.g., 2.68 g/c3). More thickly bedded sandstones are assumed to be coarser and more quartz-rich, with a lower average grain density (2.65–2.64 g/c3). The representative values were corroborated with laboratory measured grain densities (Table 2).
The calculated acoustic impedance curve was generated using the densities and matrix velocities assumed for each lithology. Expressed on the same vertical scale as the outcrop, the acoustic impedance curve can be broken down further into a “pseudo-reflectivity curve” for each of the lithologic interfaces.
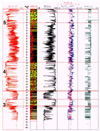
Finally, resolution differences between outcrop and logging tools must be considered. Description of the outcrops has been much finer than typical logging tools. Bedding and lithology changes across vertical distances of 5 cm (2 in.) were recorded at the outcrop. Pseudologs assumed a vertical resolution of 46 cm (~18 in.) for the gamma ray, 100 cm (~39 in.) for the deep-resistivity tool, and about 61 cm (~24 in.) for the density and acoustic tools. The abrupt, blocky shape of the pseudolog curves (Figures 2, 4) decreased as the bed thicknesses increased. Thus, gradational contacts of interlaminated lithologies could be expressed with a gradational signature on deep resistivity but more serrate for the gamma-ray curve because their vertical resolutions differ. Fluid saturations were held constant because of the low porosities measured (Table 2). Later modeling using proprietary rock/fluid substitution capability shows that a wide range of cases of rock porosity/fluid saturations can be built.
To test the value of this approach, a model of Fans 3, 4, and 5 was built at Skoorsteenberg. Total outcrop thickness measured was 205 m on a section transect following the face exposed in the right half of Figure 3. Detailed discussion of each fan and the Skoor-steenberg section appear in Wickens and Bouma (this volume).
Basson (1992) has compared outcrop data in the Tanqua Karoo to seismic data by creating synthetic geophysical logs using actual geophysical logs from the offshore Bredasdorp Basin, South Africa. Rather than building “pseudologs” from the actual outcrop mineralogy and thickness as is done here, he looked at regional distributions of fan and interfan lithologies. Therefore, the scales of resolution related to lithologic changes are different between the two approaches. Both in Basson’s work and this model, estimation of tuning thickness is very important to evaluation of seismic character for the individual fans.
Laboratory Measurement of Velocity, Fan 2
Compressional and shear wave velocities were measured on plugs cut horizontal, vertical, and at 45 degree orientation to stratification. Samples from Fan 2 “shales” were collected at Losberg (Rozman, 1998). For the limited number of samples, compressional and shear velocity anisotropies are low (Table 3). Further testing is needed to help resolve the relationship between anisotropy and the mineralogy. If the shales were more clay-rich (e.g., >70% clay) and laminated, greater Vp/Vs anisotropy can be expected.
Rock-driven seismic calibration models can be built for a variety of different depositional packages provided that outcrops are sufficiently thick (hundreds of meters) and described in detail as has been done for the Permian Ecca Group Skoorsteenberg sequence. The steps 1–7 outlined were followed to build the “pseudologs,” which led to subsequent seismic modeling (steps 8–11):
1. Describe outcrops, measure vertical thickness, subdivide into major lithologies.
2. Assign integer values to each lithology subdivision (e.g., shale, siltstone, sandstone).
3. Plot gamma-ray, resistivity, density, and acoustic pseudolog curves using unique ranges of values for each lithology, either obtained from the indurated rocks or, better, from an analogous productive field.
4. Digitize outcrop sequence with unique integers assigned to each lithology, plotted as a “log curve.”
5. Edit log suite, depth shifting, and then match to lithologic changes and plot as synthetic well including a lithology curve.
6. Calibrate “pseudogamma-ray curve” to raw scintillometer count data on multiple outcrops.
7. Calculate and plot acoustic impedance and reflectivity curves using the “pseudodensity and pseudovelocity curves.” (Calculated reflectivity is negative at the top of a sandstone overlain by a shale.)
8. Convert depth to time in the workstation environment using a zero phase wavelet of known wavelength, a desired bandpass filter, and a constant time sample interval.
9. Display synthetic zero phase seismogram on the same vertical scale as pseudologs and compare that with the seismic dataset as needed.
10. Edit bandpass filter and wavelength to produce desired seismogram for modeling.
11. Calculate tuning thickness (one-quarter wavelength) and compare to vertical lithologic section. (Note: If well logs from nearby well are available, compare synthetic seismograms.)
AVO or impedance modeling can then be conducted by varying porosity, bulk density, and fluid content. The result is a series of interpretations tied to lithologic changes that are very well documented.
At the Skoorsteenberg locale in the Tanqua Karoo subbasin, Fans 3, 4, and 5 are well exposed in vertical succession. Changes in bedding thicknesses, lithotypes, and outcrop gamma-ray measurements have been carefully recorded. The gamma-ray outcrop measurements are easily calibrated to the lithotypes, making a model of greater than 205 m thickness possible for seismic modeling purposes.
The general procedure outlined enables a geoscientist to improve the calibration of his or her seismic data beginning with the sequence of deepwater fans of the Skoorsteenberg Formation in the Tanqua Karoo. The critical linkage is generation of “pseudologs” reflecting changes in thickness and mineralogy of an outcrop of “seismic-scale” thickness. Although outcrop gamma-ray measurements confirm that pseudolog creation is valid, it is necessary to analyze compositions of the major lithology types and confirm mineral control on log response. In the depth domain, the match of synthetic seismograms using acoustic impedance and reflectivity is reliable. Conversion to the seismic time domain requires selection of representative wavelength, frequency plus bandpass filters to produce suitable data.
The short cycle time of 8 months to develop and test this modeling approach was built on the industry consortium efforts buided by Geo-Marine Consultants, the research of Drs. Arnold H. Bouma and H. DeVille Wickens and the many students of Stellenbosch, Port Elizabeth, and Louisiana State universities who collected detailed measurements of the fans and interfan exposures. Integrating the model was helped greatly by A. L. Brown, D. J. Rosman, C. F. Bauerschlag, G. Clemenceau, M. L. Suda, C. Rai, and C. Sondergeld. My thanks to all of these colleagues.
Basson, W. A., 1992, Synthetic seismogram section of the Skoorsteenberg Formation, in A. H. Bouma, ed., Tanqua Karoo fluvially dominated, shale-rich submarine fan complex: a report to a consortium of oil companies: Geo-Marine Consultants, Inc., Baton Rouge, LA, v. I, Chapter 12, p. 6–7.
Bouma, A. H., and H. DeV. Wickens, 1991, Permian passive margin submarine fan complex, Karoo Basin, South Africa: possible model of Gulf of Mexico: Gulf Coast Association of Geological Societies Transactions, v. 41, p. 30–42.
Bouma, A. H., and H. DeV. Wickens, 1994, Tanqua Karoo, ancient analog for fine-grained submarine fans, in P. Weimer, A.H. Bouma, and B.F. Perkins, eds., Submarine fans and turbidite systems: Sequence stratigraphy, reservoir architecture, and production characteristics: Gulf Coast Section SEPM Foundation 15th Research Conference Proceedings, p. 23–34.
Marot, J. E. B., 1992, Petrography of selected Tanqua Karoo sandstone, in A. H. Bouma, ed., Tanqua Karoo fluvially dominated, shale-rich submarine fan complex: a report to a consortium of oil companies: Geo-Marine Consultants, Inc., Baton Rouge, LA, v. 1, Chapter 11, p. 2–6.
McBride, E. F., 1963, A classification of common sandstones: Journal of Sedimentary Petrology, v. 33, p. 664–669.
Rozman, D. J., 1998, Characterization of a fine-grained outer submarine fan deposit, Tanqua–Karoo Basin, South Africa: Unpublished M.S. thesis, Louisiana State University, Baton Rouge, 147 p.
Scott, E. D., 1997, Tectonics and sedimentation: evolution, tectonic influences and correlation of the Tanqua and Laingsburg subbasins, southwest Karoo Basin, South Africa: Unpublished Ph.D. dissertation, Louisiana State University, Baton Rouge, 234 p.
Wickens, H. DeV., 1994, Basin floor fan building turbidites of the southwestern Karoo Basin, Permian Ecca Group, South Africa: Unpublished Ph.D. dissertation, University of Port Elizabeth, Port Elizabeth, South Africa, 233 p.