![]() Click to view figures in PDF format.
Click to view figures in PDF format.
Petroleum Industry Perspective: Mid-Year 2001
By
P.H. (Pete) Stark1
Search and Discovery Article #10021 (2001)
1Vice President Industry Relations, IHS Energy Group, Englewood, CO (www.ihsenergy.com) ([email protected])
Retrospective
At mid-year it looks like the worst of the energy crunch is over, but the problems linger on. In aftermath to high oil and gas prices, reduced oil demand accompanies limping economies, NOCs strive to increase their production, environmental and energy development proponents remain polarized, and industry faces challenging supply, demand and price scenarios. OPEC succeeded in controlling its production to maintain oil prices within its $22 to $28 target range during the first half of 2001. This could become more difficult as production capacity increases and if Iraq continues its erratic behavior. Expanding opportunities to invest in OPEC’s upstream activities may prove to be the industry’s most important new paradigms. The highlights so far are recent agreements by majors to invest $25 - $30 billion in three Saudi Arabian gas projects. Such investments could boost OPEC’s productive capacity and the shift of capital, particularly by international majors to the Middle East, should free up opportunities like onshore South America for smaller companies. In the US, the combination of fuel switching, increased conservation, mild weather, and increased supplies from new drilling reduced market worries and led to a steep decline in natural gas prices through the first half of the year. Increased drilling in mature basins alone, though, will not meet future US energy needs. Rigorous planning and flexible policies will be required. Faced with multiple uncertainties it is evident that companies are stepping up their attention to commercial and non-commercial risks. Mergers, acquisitions, and focus on high return investments with acceptable risks likely will continue.
|
uOil and gas supply, demand, and price outlook
uOil and gas supply, demand, and price outlook
uOil and gas supply, demand, and price outlook
uOil and gas supply, demand, and price outlook
uOil and gas supply, demand, and price outlook
uOil and gas supply, demand, and price outlook
uOil and gas supply, demand, and price outlook
uOil and gas supply, demand, and price outlook
uOil and gas supply, demand, and price outlook
uOil and gas supply, demand, and price outlook
uOil and gas supply, demand, and price outlook
|
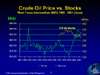
Oil and Gas Supply, Demand, and Price OutlookThe objective of this section is to present an outlook for the factors that will shape future industry trends. Oil demand has depended on the strengths of global economies and prices, which, in turn, have depended on OPEC’s ability to control its supplies. Even though OPEC boosted its production quotas by 3.7MMb during 2000, the steep escalation of oil prices was propelled by slow build of oil stocks and realization that excess production capacity had shrunk to the lowest level since the late 1970s. During the first half of 2001, OPEC reduced its quotas as stocks improved and average US crude was $25.30 (WTI = $28.30), right in the middle of OPEC’s targeted $22-$28 price band. Expecting a global economic rebound and higher oil demand, EIA forecasts WTI will average $28 again in 2002 but expects gradual price reductions in following years due to increasing production capacities. Several factors suggest, however, that production capacities may grow sooner than expected and that OPEC will be challenged to control production and maintain prices within its target range. First is the opening of global E&P opportunities. All but a few producing countries, including major OPEC producers, have (or are considering) programs to stimulate outside investments in their E&P sectors. Investments by majors to develop large OPEC reserves plus a global increase in exploration activity could boost global capacity by as much as 2 MMb/d during 2001 and OPEC plans to add 1 MMb/d or more for each of the next 4 years. Countries that add capacity likely will want to produce it, making it difficult for OPEC to maintain quotas and prices. In fact, OPEC is considering an emergency meeting to lower its September, 2001, quota by 1.0 MMb/d in order to offset resumption of Iraq exports and to boost prices into the middle of its target range. Volatility with downward pressure on prices could result, and we may experience additional roller coaster cycles over the next several years. Crude Oil Price vs. Stocks (Figure 1)
OPEC is concerned about soft world oil demand and considers dropping its quotas to maintain its price floor. If, however, seasonal demand increases, excess oil stocks could be erased by October, and prices could strengthen into the 4th quarter. EIA expects WTI to add about $2/bbl by 4th quarter and to average $28 during 2002. Contrary to EIA projections, IHS data suggest that increased global exploratory drilling should boost production capacities and stocks during 2002. If so, OPEC will be stressed to maintain its price band. OPEC Quotas and Production (Figure 2)
It now looks as though OPEC may have to reduce its quotas to maintain prices even though seasonal 4th quarter increases in demand eventually may exceed 27.3MMb/d. New and proposed E&P investments could boost OPEC production capacity by more than 1MMb/d during 2001 and again in 2002. At issue is whether OPEC will be capable of managing its price band mechanism through 2002 while faced with increasing production capacities and whatever Iraq attempts to upset oil markets. The outlook is for continued volatility and a bias toward lower prices. World Oil Demand (Figure 3)
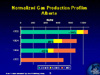
In order to achieve 117 MMb production, OPEC would have to increase its market share to almost equal non-OPEC production at around 58 MMb/d by 2020. Are there sufficient global resources, and can they be produced at an affordable cost to meet this demand? Some believe that global oil production will soon peak, and there is no way to grow production by 55%. Political reactions to reduce dependency on oil and to reduce greenhouse gases, though, could reduce future oil demand growth from the forecast. Natural Gas CommentaryNorth America weathered last winter’s gas supply and price crunch, and the market is in the process of sorting out “what next”. Keys to the unexpected rapid recovery were fuel switching that cut winter demand by about 5 Bcfd, reduced industrial demand due to the soft economy, and mild spring weather that allowed record high storage refill rates. Gas storage, which was at record low levels during March, zoomed to above average levels by the first week of July and gas spot prices dropped by $2.00 to average $3.06 during July before declining below $2.40 by the end of August. Despite the rapid market adjustments, the US gas industry did not survive unscathed. Consumer trust and expectations have changed along with a reawakened conservation ethic. Some industrial users are gone, and others improved their fuel switching capabilities. Some planned gas fired power could be delayed, LNG import capacities are expanding, and policy makers are promoting development of frontier gas resources and other options. Prompted by latest indicators that 2001 U.S. gas demand could decline by 300 Bcf, EIA (September 2001) lowered its projected US average wellhead price to $4.20 in 2001 and $2.65 in 2002. EIA believes that supplies will be adequate to cover predicted 4.6% (1.03 Tcf) growth in demand that would accompany an economic rebound in 2002. Recent extrapolations from IHSE databases indicate that even current levels of Canadian and US gas directed drilling could be pressed to cover a 1.03 Tcf increase. If so, US gas supply and demand margins would narrow and increase the likelihood for higher prices by the end of 2002. Projections indicate a 40% increase in gas drilling could boost 2001 US gas production by about 725 Bcf and western Canada could add an additional 200 Bcf. Barring aberrant weather, this should be sufficient to fill storage to capacity, supply new gas fired power plants, and satisfy normal demand during the 2001-2002 winter heating season. Projections indicate, however, that almost 1,000 gas rigs must be sustained to cover a 1.03 Tcf increase in demand. This is due to the rapid decline rates and trend toward lower reserves in recent gas wells. Moreover, it is expected that gas drilling will decrease in the face of wellhead prices below $2.50 /Mcf. According to Baker Hughes, September 7, 2001, US gas directed rig activity dropped below 1,000 rigs for the first time in 15 weeks. Continued declines in gas drilling activity would increase the likelihood of tighter supplies and higher prices if the EIA’s gas demand forecast is realized. It looks like natural gas spot prices could average about $3.90 /Mcf during 2001 and $2.25 - $3.00 (or lower!) during 2002. Supply/demand margins are precarious and subject to multiple variables. Bias toward the lower end of this price range could result through continued high levels of US and Canadian gas drilling, increased conservation, slow economic recovery, and continued moderate weather. Weather and distribution constraints, on the other hand, also could create significant short-term regional price spikes. Thus, the stage is set for possible near-term gas price volatility. 1,000 gas rigs could produce excess supplies, but 900 could produce too little. These factors speak to the need for rigorous economic planning models to guide industry on a smoother path. Productivity changes in key producing provinces underlie long-term gas supply concerns. Production decline rates have accelerated over the past decade, the gas resource base has disappointed in some basins, and there is a tendency for average well quality to decline when drilling increases. In the Gulf of Mexico (GOM), the first year decline rate doubled from 27% in 1994 to almost 55% in 1999 and deepwater trends have tended to be oil prone. As a result, increases in deepwater gas well production from 1997 through 1999 added only 1 Tcf in annual production compared to 3 Tcf decline in production from the shelf. And initial year-end data indicate shelf production continued to decline during 2000 in spite of a robust increase (>50%) in gas completions. The annual base decline in offshore GOM gas well production is about 22%. This means that annual gas well drilling must contribute 900 Bcf in new production just to sustain production capacity. The deepwater Gulf may not be able to deliver the volumes required to meet demand forecasts. Similarly, deterioration in Alberta gas well productivity is evident in Figure 6 by significant increases in decline rates and decrease in peak production volume between 1990 and 1999. Correspondingly, the USGS in its World Petroleum Assessment 2000 dropped its estimate of Western Canada gas resources to 19 Tcf. This compares to an estimate of about 170 Tcf by a Canadian source. Gas productivity trends in the US Lower Forty-eight States present a mixed bag, as shown in Figure 7. First year average decline rates increased, but average new well peak production improved from1990 to 1999. However, these characteristics of mature producing provinces will not improve through time, and industry cannot just drill its way out of supply crunches. Thus, in order to meet long-term demand, gas supplies must increase through continued robust drilling in established North American producing basins, and new supplies like arctic gas and LNG imports must be tapped. It is expected that international gas developments will continue to expand and will capture an increasing share of worldwide capital expenditures. Supplying the growing US LNG market and contributing to expanding liquids demand through GTL technologies could become increasingly important in selected international gas developments. World Natural Gas Demand (Figure 4)
US Natural Gas Spot Prices (Figure 5)
Gas Production Profiles, Alberta and US Lower 48 States (Figures 6 and 7)
Industry TrendsIndustry Trends CommentaryThe objective of this section is to highlight likely industry behavior and activities that should prevail in response to continued volatility in oil and gas supplies, demand, and prices. Key factors that are expected to dominate long-term industry strategies and trends include: § Long-term demand growth should continue to drive the need to expand oil and gas production capacity. § The global shift toward natural gas should continue. § Political and market forces should tend to cap long-term inflation-adjusted gas prices in the $3.50 to $4.00 range, and oil prices in the $25.00 to $30.00 range. § Increasing pro-environmental public-policy pressures increasingly may moderate hydrocarbon demand growth, curtail environmentally sensitive development, increase costs, and accelerate the shift to alternate energy sources. § “Big oil needs big oil”. Majors will focus on areas with large reserves and access to markets – like the Middle East, North Africa, FSU, & deepwater plays. § Growing independent operators and even NOCs will fill the voids – like onshore Latin America, US Gulf of Mexico shelf, and UK continental shelf - vacated by majors. § Competition among NOCs to attract capital should intensify. § Industry consolidations and restructuring will continue in response to changing industry dynamics. The number of global operators will continue to shrink. § It is observed that the 1998-99 oil price collapse created much more pain and havoc to the industry than the sum of the dry holes over this period. This may signal an important paradigm shift from the era of managing technological risks to the era of managing commercial and non-commercial risks. Industry and public policy makers must plan and manage energy development through these challenges. World Regional Rig Counts (Source: Baker-Hughes) (Figure 8)
Review of IHSE well spuds indicates that countries with open, active licensing practices, stable operating environments, and low to moderate risks have tended to record the largest increases in drilling activity. The moderate rate of international drilling expansion since the 1998-1999 oil-price collapse is consistent with patterns over the past decade, but it may reflect other concerns. Continuing excess OPEC producing capacity, major operators’ focus on projects with large reserves and producing capacity, expanding opportunities in the Middle East, and heightened attention to non-commercial risks may contribute to the less robust growth in international drilling. International Exploratory Well Ends (Figure 9)
Thirteen years ago (1988), international exploratory drilling represented 42% of total wells but declined to only 25% of total wells by 1999. YTD 2001 exploratory drilling has rebounded to comprise 31% of total wells. This uptick might prove to be only a temporal response to cover exploration projects that were suspended during the 1998-1999 oil price collapse. YTD 2001 international seismic activity, a traditional indicator for new exploration, is up only 7% from 2000. Regardless, increased exploratory drilling should yield important new discoveries and reserves that would generate future increases in development well drilling and production. Kashagan, a super-giant 2000 discovery in the north part of the Caspian Sea, is a case in point. Reports credit Kashagan with 3,000 meters of pay and possible reserves that could range from 20 to 60 Bbo! This discovery could forge significant shifts in future oil supplies. A long-term concern, though, is the fact that international discoveries over the past decade (including Kashagan at 20 Bbo) have yielded only about 14 Bbo per year in oil reserves compared to current 27.8 Bbo annual demand. Including reserve growth factors and adding US and Canadian reserves still do not cover current demand. This does not portend calamity but speaks to the importance of sustaining a healthy level of global exploratory drilling. YTD 2001 development well ends are about flat with 2000. Gains in Africa, Australasia and Europe offset deficits in the Far East, Latin America, and Middle East. International Licensing Activity (Figure 10)
Global Areas of Interest (Figure 11) |
 Figure
1. Crude oil price vs. stocks
Figure
1. Crude oil price vs. stocks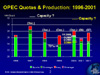 Figure
2. OPEC quotas and production
Figure
2. OPEC quotas and production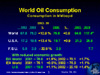 Figure 3. World oil demand
 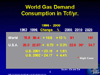 Figure
4. World natural gas demand
Figure
4. World natural gas demand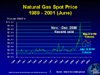 Figure
5. US natural gas spot prices
Figure
5. US natural gas spot prices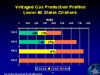
 Figures
6 and 7. Alberta normalized gas production profiles and US Lower 48 States
vintaged gas production profiles
Figures
6 and 7. Alberta normalized gas production profiles and US Lower 48 States
vintaged gas production profiles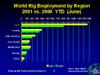 Figure
8. World regional rig counts (source: Baker-Hughes)
Figure
8. World regional rig counts (source: Baker-Hughes) Figure 9. International exploratory well ends
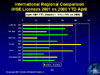 Figure
10. International licensing activity
Figure
10. International licensing activity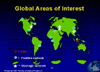 Figure
11. Global areas of interest
Figure
11. Global areas of interest