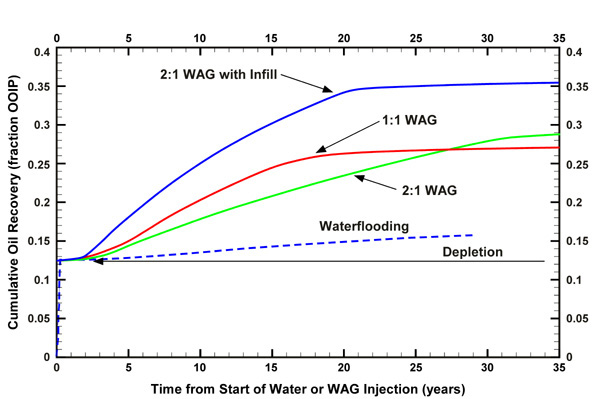
Figure 32. Plot showing recovery in time after water or WAG (water alternating with gas) injection in years versus the cumulative oil recovery as fractions of OOIP, VLC-363, Block III field.
Figure 32. Plot showing recovery in time after water or WAG (water alternating with gas) injection in years versus the cumulative oil recovery as fractions of OOIP, VLC-363, Block III field.