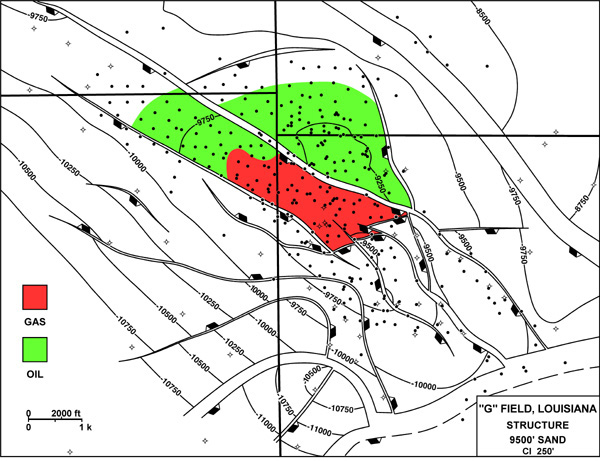
Figure 22. Structure map on top of the 9500 ft. sand showing the new distribution of oil and gas resulting from recompleting the low resistivity intervals in the sand, “G” field, coastal Gulf of Mexico, Louisiana.
Figure 22. Structure map on top of the 9500 ft. sand showing the new distribution of oil and gas resulting from recompleting the low resistivity intervals in the sand, “G” field, coastal Gulf of Mexico, Louisiana.