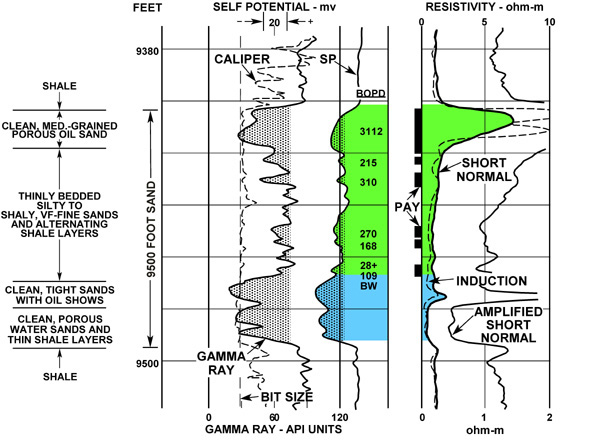
Figure 20. Well logs of the 9500 ft. reservoir sand in a 1989 well, “G” field, coastal Gulf of Mexico. This new cored well is less than 10 meters from a 1940s well that produced from the upper 20 ft. of the 9500 sand. The low resistivity interval below the high resistivity interval was never tested because it was interpreted as wet. This low resistivity interval production tested about 1000 BOPD. Each individual flow test was 30 days.