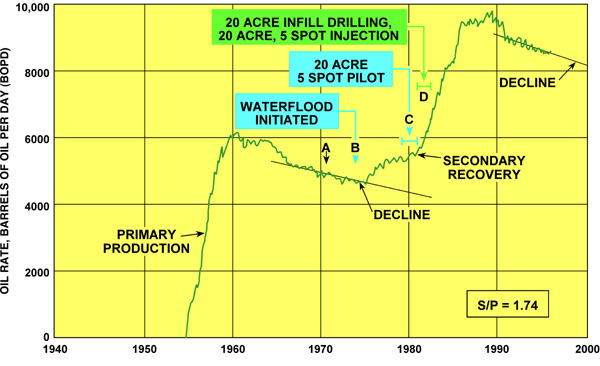
Figure 15. Graph illustrating primary and secondary waterflood production, San Andres “C” waterflood unit, Permian Basin, Texas. Note the significant increase in production starting at Time “D” which resulted from a 20-acre, 5-spot pattern waterflood and perforating all pay zones.