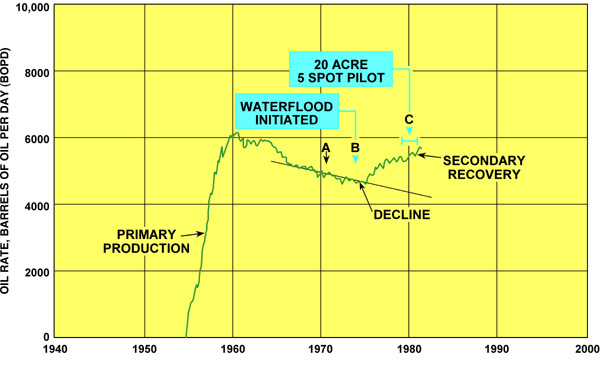
Figure 13. Graph showing oil production during primary recovery and secondary peripheral waterflood production and the 20-acre, 5-spot pilot flood until December 1980. San Andres “C” waterflood unit, Permian basin, Texas.
Figure 13. Graph showing oil production during primary recovery and secondary peripheral waterflood production and the 20-acre, 5-spot pilot flood until December 1980. San Andres “C” waterflood unit, Permian basin, Texas.