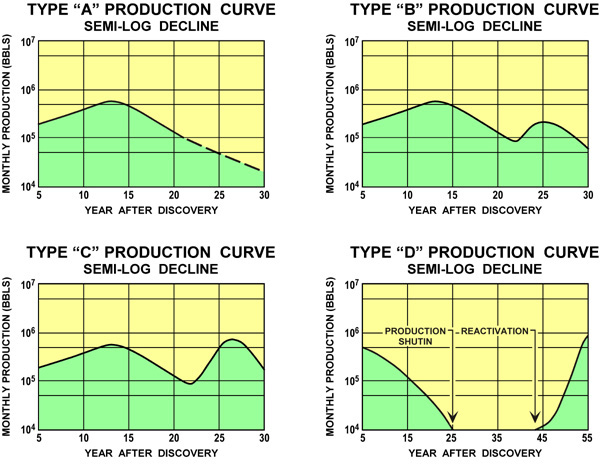
Figure 2. Type “A” graph illustrates a typical production decline curve of a depletion reservoir. Type “B” production decline shows a secondary production increase resulting from infill drilling, recompletions, workovers and/or flooding. Type “C” production curve shows the secondary production is higher than the initial production rate. Type “D graph is typical of a rejuvenated marginal field. Production increases are the result of operations similar to Type “B” and Type “C”.