TIGHT
GAS SAND EXPLOITATION: LINKING GEOSCIENCE TO ENHANCE OPERATIONS,
Siberia Ridge ![]() Field
Field![]() , Wyoming*
, Wyoming*
by
Lesley W. Evans,1 Barbara F. Keusch, 1 Stephen D. Sturm, 1 and William J. Clark1
Search and Discovery Article # 20006 (2001)
*Adapted
for online presentation from poster session presented at the AAPG Convention,
Denver, CO, June 2001. Please refer to: Topical Report
GRI-00/0026, entitled “Multi-Disciplinary ![]() Analysis
Analysis![]() of Tight Gas
Sandstone Reservoirs, Almond Formation, Siberia Ridge
of Tight Gas
Sandstone Reservoirs, Almond Formation, Siberia Ridge ![]() Field
Field![]() , Greater Green River
Basin,” prepared for Gas Research Institute, Exploration and Production
Business Unit, January, 2000, by Schlumberger Holditch-Reservoir Technologies,
Inc., Denver, CO.
, Greater Green River
Basin,” prepared for Gas Research Institute, Exploration and Production
Business Unit, January, 2000, by Schlumberger Holditch-Reservoir Technologies,
Inc., Denver, CO.
1Schlumberger Holditch-Reservoir Technologies, Denver, CO (www.slb.com) ([email protected]). Acknowledgments are extended to GTI (formerly Gas Research Institute), BP-Amoco, The Discovery Group, GeoQuest ICS, and Schlumberger Holditch-Reservoir Technologies. ** Mark of Schlumberger.
Editorial Note: This article, which is highly graphic (or visual) in design, is presented as: (1) nine posters, with (a) each represented in JPEG by a small, low-resolution image map of the original; each illustration or section of text on each poster is accessible for viewing at screen scale (higher resolution) by locating the cursor over the part of interest before clicking; and (b) each represented by a PDF image, which contains the usual enlargement capabilities; and (2) searchable HTML text with figure captions linked to corresponding illustrations with descriptions.
Users without high-speed internet access to this article may experience significant delay in downloading some of these illustrations due to their sizes.
First Poster
Second Poster
Third Poster
Fourth Poster
Fifth Poster
Sixth Poster
Seventh Poster
Eighth Poster
Ninth Poster
The
Siberia Ridge ![]() Field
Field![]() Reservoir Characterization study is based on full-
Reservoir Characterization study is based on full-![]() field
field![]() geoscience,
geoscience, ![]() petrophysical
petrophysical![]() and engineering analyses including the results of a
cooperative research well. This Gas Research Institute funded study provides
insight into mechanisms controlling gas production in Siberia Ridge
and engineering analyses including the results of a
cooperative research well. This Gas Research Institute funded study provides
insight into mechanisms controlling gas production in Siberia Ridge ![]() Field
Field![]() ,
southwestern Wyoming. The purpose of the study was to characterize the Almond
Formation (Cretaceous) to better understand controls on productivity and to
compile this information for analogous tight-gas sandstone reservoirs.
,
southwestern Wyoming. The purpose of the study was to characterize the Almond
Formation (Cretaceous) to better understand controls on productivity and to
compile this information for analogous tight-gas sandstone reservoirs.
Geological
facies ![]() analysis
analysis![]() ,
, ![]() petrophysical
petrophysical![]() data, and seismic attribute data were mapped with
production data to determine productive trends. Coherency
data, and seismic attribute data were mapped with
production data to determine productive trends. Coherency ![]() analysis
analysis![]() was used to
determine the location of significant linear features. The combination of
depositional,
was used to
determine the location of significant linear features. The combination of
depositional, ![]() petrophysical
petrophysical![]() , and structural data revealed areas of better
, and structural data revealed areas of better
![]() petrophysical
petrophysical![]() properties that generally indicated better production. This was
apparent even within a small range of reservoir quality.
properties that generally indicated better production. This was
apparent even within a small range of reservoir quality.
With average reservoir porosity ranging from eight to ten percent and matrix permeability in the microdarcy range, the role of natural fractures to productivity was of particular interest. FMI** and core data were used to characterize the natural fracture system. Natural fracture density was influenced more by lithology than lineament proximity or increased intersections resulting from wellbore deviation. Rather than providing increased conductivity to natural gas, natural fractures were found to provide increased relative permeability to deeper Almond water.
Specific
completion practices were evaluated with geological and ![]() petrophysical
petrophysical![]() data to
determine relationships to gas production. Results indicated that completion
practices were critical to well performance.
data to
determine relationships to gas production. Results indicated that completion
practices were critical to well performance.
Enhanced reservoir understanding can improve drilling, completion and production practices, ultimately affecting well economics by decreasing risk and increasing recoverable reserves.
|
uLinear features and fractures
uLinear features and fractures
uLinear features and fractures
uLinear features and fractures
uLinear features and fractures
uLinear features and fractures
uLinear features and fractures
uLinear features and fractures
uLinear features and fractures
uLinear features and fractures
uLinear features and fractures
|
Click here for sequence of Figures 2.1a and 4.4. Click here for sequence of Figures 2.1b, 3.4, 3.5, 4.1, 4.2.
Click here for sequence of Figures 2.1b, 3.4, 3.5, 4.1, 4.2.
Click here for sequence of Figures 2.1b, 3.4, 3.5, 4.1, 4.2.
The following are objectives and scope of the project (Figure 1.1):
Integrate results of seismic and reservoir property mapping to identify discrete relationships: · Better understand the interplay between matrix and fractures with regard to reservoir performance. · Understand subsurface natural fracture density and relate this to improved gas recovery and lineament proximity. Compare these findings with historical completion practices to determine effective methods to improve gas recoveries. Reservoir Performance is the summation of the Reservoir and the Production and Engineering (Figure 1.2). In this study, key features related to the reservoir are the matrix (facies, especially lineament / channel focusing and coal distribution) and the fractures, especially as they relate to lithology and lineament proximity. Reservoir components, perforation practices, and stimulation practices are key elements of production and engineering practices. Tasks to perform include the following (Figure 1.3): Shoot
3-D seismic with appropriate design for target interval: Interpret
structure and faults; perform coherency and attribute Determine areas of accommodation (faults, linear features, paleo-lows, interval thickness). Integrate
existing data and maps to determine favorable depositional/ Balance objectives with acreage and EIS issues. Determine location and drill. “Short Drill” ALM bar - ALM400. “Long Drill” ALM bar - ALM700. Run and evaluate mud and open hole logs. Option to set intermediate casing. Run mud and open hole logs include FMI**. Select intervals to perforate (perforation density not less than 4spf ). Evaluate lower Main Almond interval for Sw and fractures to mitigate water risk. Select stimulation grouping (less than 100 feet gross interval). Run Plt’s and obtain pressure data periodically to evaluate performance. The
Siberia Ridge Reservoir Characterization study area is located on the
north flank of the Wamsutter Arch, in the Great Divide Basin of
southwestern Wyoming (T21-22N and R94-95W) (Figure
2.1a). The Productivity
varies significantly throughout the In the Washakie Basin, Almond Formation thickness varies from 250 to greater than 500 feet. These variations in lithofacies are thought to be due to syndepositional movement along basement block faults (Martinsen et al., 1995). The Almond is a major transgressive sequence, composed of smaller transgressive-regressive cycles that have been divided into the Upper and Main Almond zones (Figure 2.3). The Upper Almond is composed of marine sandstones, whereas the Main Almond consists of brackish to nonmarine interbedded sandstones, siltstones, shales and coals. The
underlying Ericson Sandstone (Figures 2.2 and
2.3) is predominantly
nonmarine, composed of amalgamated fluvial sandstones interbedded with
floodplain deposits. Within the area of the Siberia Ridge The Almond Formation can be divided into two genetic units, the Main and Upper Almond (Figures 3.1 and 3.2). The division between these two units is typically defined by the initial occurrence of a correlatable transgressive marine shale above the continental Main Almond interval. The Almond 100 through Almond 700, or Main Almond, is approximately 450 ft thick and is composed of 40-70 ft ‘depositional sequences’ dominated by lenticular, tidal flat and tidal channel sandstones encased within bayfill and estuarine shales. Individual sequences are bounded by continuous coal beds and carbonaceous shales. These sequences become increasingly marine upwards. Sandstones in the Main Almond are dominated by tidal facies which are highly compartmentalized and have limited connectivity. Drainage area or radius generally falls below well spacing. The
composite sandstone at the top of the sequence, commonly referred to as
the Almond ‘bar,’ is the primary pay zone. Within Siberia Ridge
Detailed
sedimentological, stratigraphic and Petrographic
and Linear Feature Determination and Fracture Characterization and Density
Click here for sequence of Figures 2.1b, 3.4, 3.5, 4.1, 4.2.
Click here for sequence of Figures 2.1b, 3.4, 3.5, 4.1, 4.2.
Click here for sequence of Figures 2.1a and 4.4.
Linear features were initially identified with seismic data. Figures 4.1 and 4.2 compare the derivative of the Madison-Almond isochron map (Figure 4.1) and the seismic dip map (Figure 4.2). In Figure 4.1, the areas of red and yellow denote regions of greater flexure within the Madison-Almond time interval. The seismic dip map is a display of the magnitude of the time dip of the autopicked Almond seismic event. Lighter shades of gray denote areas of relatively flat dip, whereas darker shades indicate steeper structural dip. The three most significant features are the en echelon northeast-trending linear features: the SRU and 5-2 which roughly correspond to the Ransome lineament as drawn on Figure 4.3 and the Wamsutter lineaments. The northwest-trending features (N1-N10, S1-S7) terminate abruptly at the 5-2 lineament and cannot be verified from wellbore data; however, the orientation of these segmented linear features is also identified on the modified Digital Elevation Model (Figure 4.4). The
yellow circles on the seismic dip map (Figure
4.2) indicate the
locations of •SRU #27-4 (FMI**, DSI), 1380 ft from Wamsutter Lineament, 313 ft from S5. •SRU #5-2 (FMI**, DSI and Core, deviated wellbore), 814 ft from 5-2. Lineament at surface; intersects 5-2 Lineament in the ALM400 interval. •SRU #5 (Core), 3,000 ft from nearest lineament.
Fracture Density Relationships
Table 5.1. Fracture spacing (in inches) in each plane.
Fracture
density in the deviated (45º) Siberia Ridge #5-2 Almond bar through
Almond 300 intervals (Figure 4.6) is greater than in the vertical Siberia
Ridge vertical fracture density ranges from one fracture every 5.5 feet
to less than 1 fracture per foot. Fracture density increases with depth
in each of the key Siberia Ridge Investigation of the wellbore geometry shows that the fracture spacing reported for the Siberia Ridge #5-2 is in the Z direction, whereas those reported for the Siberia Ridge #27-4 and Siberia Ridge #5 are in the Y direction (Figure 5.4). Even though the Siberia Ridge #5-2 is deviated, the average fracture spacing, as determined from FMI**, is similar to the Siberia Ridge #27-4 (Figure 5.2). To
understand the effect of drilling near and/or through the 5-2 Lineament,
the fracture spacings are compared on the same plane. Siberia Ridge
#5-2’s fracture density converted to fracture spacing, DX,
equals 4 inches, whereas fracture density for the vertical What is the effect of wellbore deviation? Utilizing the geometric relationships obtained from these figures and equations, the spacings in each plane are reported in Table 5.1. The
geometrical difference between DZ and DY spacing
is a factor of 4.7, and the fracture density difference between the
In summary, wellbore deviation impacts fracture density by a factor of 4.7; lineament proximity impacts fracture density by a factor of 1.4
Table 5.2 Equations for fracture permeability (from Aguilera, 1995).
Fracture permeability is inversely proportional (both numerically and linearly) to the distance between fractures. Fracture permeability is also proportional to the cube of the fracture width. From a mathematical standpoint (Table 5.2), the fracture width effects fracture permeability more than fracture spacing (Figures 5.5, 5.6, and 5.7). The
bar graph (Figure 5.8) of mean fracture permeability (k2,
parallel planes) shows mean k2 permeabilities of 5 md to 225
md. Fracture permeability is lowest in both There is tremendous fracture permeability (225 md) in the Siberia Ridge #5-2, Almond 500 interval. Since fracture spacing is the same as the Siberia Ridge #27-4 in this interval, why is fracture permeability so high? A
glance at the distribution of fracture apertures (Figure
5.9) answers this
question. The very large apertures in this interval are masked by the
interval mean. For this reason, fracture data needs to be manipulated
and viewed a number of different ways. Averaged data allows for ease of
comparison between
Table 6.1. Productivity comparison determined by distance from linear feature.
Gas
production in Siberia Ridge Most
Initial
production rates for the Main Almond are higher and decline more rapidly
than production from the Almond Bar (Figure
6.2). This is due to the
areally limited size of Main Almond reservoirs. Production logs (Figures
6.3 and 6.4) support this geologic interpretation, which is also
observed in the decline curves for Main Almond Perforating
the lower Main Almond increases exposure to high water production. Many
of the Almond 600 and Almond 700 perforations are plugged back, and few
What is the impact of different completion technologies? The graphs in Figures 6.6 and 6.7 demonstrate that higher perforation density (Figure 6.6), limiting the gross stimulated interval to under 100 feet (Figure 6.7), and utilizing discrete or point sources treatment methods improve gas recovery. An
increase in initial and long term productivity is observed in some For
Click here for sequence of Figures 7.1a, 7.1b, 7.2, 7.3.
Click here for sequence of Figures 7.1a, 7.1b, 7.2, 7.3.
Click here for sequence of Figures 7.1a, 7.1b, 7.2, 7.3.
Reservoir Quality (Matrix) (Figures 7.1,7.2) 1. Linear features delineate paleo-lows, where better reservoir quality sands were deposited in channels. 2. Mapped areas of higher matrix quality are generally areas of higher productivity. 3. Roughly 90% of produced gas is from the Almond Bar. Natural Fractures (Figure 7.3) 1. Fracture density depends mostly on lithology. 2. Wellbore deviation effectively increases fracture density (permeability) more than lineament proximity. 3. Water production in the SRU #27-4 and SRU #5-2 is from highly fractured intervals. 1.
Decline curves from Upper Almond Bar 2. Tidal channel reservoirs (Figure 7.2) have a better EUR than shoreface reservoirs due to matrix quality. 3. Hydraulic stimulations stages should access less than 100 feet per treatment. Single reservoirs should be targeted. Economic success is measured by improved well recovery and reduced cost through site selection, pay determination, natural fracture characterization, completion optimization, and recompletion potential. These are achieved by: Designing appropriate 3-D seismic for target interval. Determining areas of accommodation (faults, linear features, paleo paleo-lows, interval thickness). Integrating with existing
data and maps to determine favorable depositional and depositional and
• Targeting channel areas of high matrix quality. • Intersecting linear features in the Almond bar. • Avoiding lower Main Almond sandstones unless precautions are taken for overpressure. Recalculate Rw and Sw for proper formation interpretation. Running mud and open hole logs including FMI** for fracture interpretation. Drilling non-vertical wellbores. Utilizing staged hydraulic stimulation techniques with a minimum perforation density of 4 shots per foot.
Implementing the information presented in this study will increase asset value through improved well recovery, higher initial rates (IP), and a decrease in drilling and operational costs. This is accomplished through better infill drilling location selection and advantageous completion practices. As a result, average infill locations will recover greater than .5 to 1.5 BCF per well over historical Almond well completions.
Aguilera, R., 1995, Naturally fractured reservoirs, Second Edition: Tulsa, PennWell Publishing Company, 521p. Gomez, E., Horne, J., Forster, J., Sturm, S., 1995, Stratigraphic framework and facies distribution of the Frontier Formation, Moxa Arch, Consortium for emerging gas resources in the Greater Green River Basin, in Geological characterizations of the Cretaceous gas plays in the Greater Green River Basin: GRI 95/0450, p 115. Jaworowski,
Cheryl, and Robert Simon, 1995, Relating fractures in the eastern
Greater Green River Basin to oil and gas fields: integrating Martinsen, Randi S., Glen E. Christiansen, Mark A. Olson, and Ronald C. Surdam,1995, Stratigraphy and lithofacies of the Almond Formation, Washakie and Great Divide basins, Wyoming, in Resources of Southwestern Wyoming: WGA Guidebook, p. 297-310. |
 Figure
1.3. Workflow strategy.
Figure
1.3. Workflow strategy.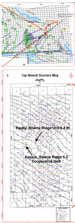 Figure
2.1. Tectonic map of Greater Green River Basin, with outline of study
area (a), modified from Gomez et al., 1995); top Almond structure map of
Siberia Ridge
Figure
2.1. Tectonic map of Greater Green River Basin, with outline of study
area (a), modified from Gomez et al., 1995); top Almond structure map of
Siberia Ridge  Figure
2.2. Regional cross section of Almond Formation, Washakie Basin
Figure
2.2. Regional cross section of Almond Formation, Washakie Basin Figure
3.1 - Schematic Almond cross section
Figure
3.1 - Schematic Almond cross section Figure
3.2 - Siberia Ridge type log
Figure
3.2 - Siberia Ridge type log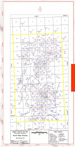 Figure
3.4 - Upper Almond kh map.
Figure
3.4 - Upper Almond kh map.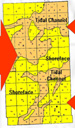 Figure
3.5 - Almond bar depositional facies map.
Figure
3.5 - Almond bar depositional facies map.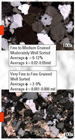 Figure
3.6 - Matrix
Figure
3.6 - Matrix 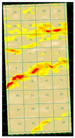 Figure
4.1. Isochron derivative map.
Figure
4.1. Isochron derivative map.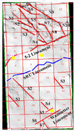 Figure
4.2. Seismic dip map.
Figure
4.2. Seismic dip map. Figure
4.3. Study area, showing linear features (reprinted and modified from
Jaworowski and Simon, WGA Guidebook, 1995).
Figure
4.3. Study area, showing linear features (reprinted and modified from
Jaworowski and Simon, WGA Guidebook, 1995). Figure
4.4. Digital elevation model of southwest Wyoming, with linears and
location of study area (reprinted and modified from Jaworowski and
Simon, 1995).
Figure
4.4. Digital elevation model of southwest Wyoming, with linears and
location of study area (reprinted and modified from Jaworowski and
Simon, 1995). Figure
4.5. Natural fracture characterization: FMI** (lithologically-bound
fractures), rose diagram (natural fracture strikes), and core photos.
Figure
4.5. Natural fracture characterization: FMI** (lithologically-bound
fractures), rose diagram (natural fracture strikes), and core photos. Figure
4.6. Fracture density in non-vertical well.
Figure
4.6. Fracture density in non-vertical well.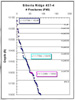 Figure
4.7. Fracture density in vertical well.
Figure
4.7. Fracture density in vertical well. Figure
5.1. Vertical and deviated well comparison: Fracture occurrence
increases with depth.
Figure
5.1. Vertical and deviated well comparison: Fracture occurrence
increases with depth. Figure
5.2. Vertical and deviated well comparison: Average fracture spacing
decreases with depth.
Figure
5.2. Vertical and deviated well comparison: Average fracture spacing
decreases with depth. Figure
5.3. Vertical and deviated well comparison: Sandstone thickness
increases with depth.
Figure
5.3. Vertical and deviated well comparison: Sandstone thickness
increases with depth. Figure
5.4. Fracture frequency as a function of wellbore geometry
Figure
5.4. Fracture frequency as a function of wellbore geometry  Figure
5.5. Fracture spacing.
Figure
5.5. Fracture spacing. Figure
5.6. Fracture aperture.
Figure
5.6. Fracture aperture. Figure
5.7. Hydraulic fracture aperture.
Figure
5.7. Hydraulic fracture aperture. Figure
5.8. Fracture permeability.
Figure
5.8. Fracture permeability. Figure
5.9. Distribution of fracture apertures.
Figure
5.9. Distribution of fracture apertures. Figure
6.3. Formation productivity, SRU #5-2. Fracture productivity: vertical
profile of spinner, fracture permeability, and mud-gas data. Horizontal
lines represent stratigraphic interval markers.
Figure
6.3. Formation productivity, SRU #5-2. Fracture productivity: vertical
profile of spinner, fracture permeability, and mud-gas data. Horizontal
lines represent stratigraphic interval markers. Figure
6.4. Formation productivity SRU, #27-4. Fracture productivity: vertical
profile of spinner, fracture permeability, and mud-gas data. Horizontal
lines represent stratigraphic interval markers.
Figure
6.4. Formation productivity SRU, #27-4. Fracture productivity: vertical
profile of spinner, fracture permeability, and mud-gas data. Horizontal
lines represent stratigraphic interval markers. Figure
7.1. Comparison of the Upper Almond facies and production map (a) to the
Almond-Madison isochron (b). The drainage divide separating the two
northeast-trending channel complexes is thought to be a syndepositional
feature related to inherited Paleozoic structural features. The SRU
Lineament defines the hinge of the paleostructure and Upper Almond
drainage divide. The 5-2 Lineament forms the approximate southern
boundary of the northern channel complex. Bubbles of cumulative gas
production (normalized for the 1st 180 days) are displayed on the facies
map.
Figure
7.1. Comparison of the Upper Almond facies and production map (a) to the
Almond-Madison isochron (b). The drainage divide separating the two
northeast-trending channel complexes is thought to be a syndepositional
feature related to inherited Paleozoic structural features. The SRU
Lineament defines the hinge of the paleostructure and Upper Almond
drainage divide. The 5-2 Lineament forms the approximate southern
boundary of the northern channel complex. Bubbles of cumulative gas
production (normalized for the 1st 180 days) are displayed on the facies
map.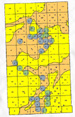 Figure
7.2. Facies control on production: 27 Upper Quartile
Figure
7.2. Facies control on production: 27 Upper Quartile  Figure
7.3. Combinations of matrix and mechanical (natural fracturing)
attributes are compared to initial 180 days of production. These areas
of upscaled attributes (kh, coal, fractures) account for approximately
60% of the Almond gas.
Figure
7.3. Combinations of matrix and mechanical (natural fracturing)
attributes are compared to initial 180 days of production. These areas
of upscaled attributes (kh, coal, fractures) account for approximately
60% of the Almond gas.