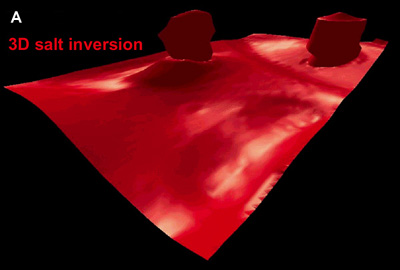
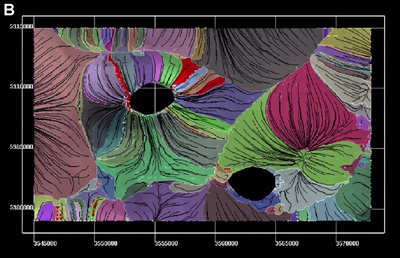
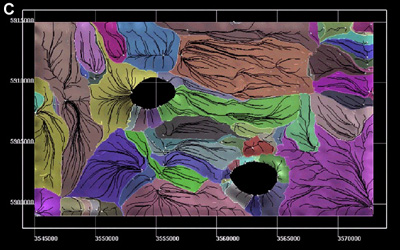
Figure 5.1. 3D salt inversion. A. Diagram of diapirs and top salt. B,C. Balanced and restored models of salt inversion. Flow packages represented by different coloured areas.
Figure 5.1. 3D salt inversion. A. Diagram of diapirs and top salt. B,C. Balanced and restored models of salt inversion. Flow packages represented by different coloured areas.