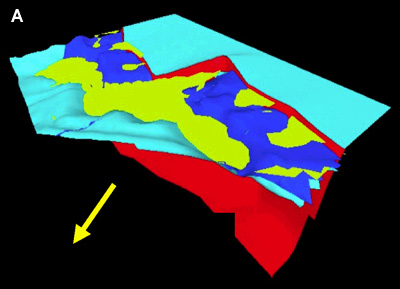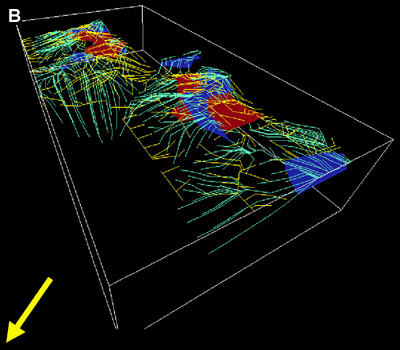


Figure 4.2. Different traps, migration fairways, and catchment areas form with time during inversion. A. Model after inversion, with same orientation as in Figure 4.2A. B. Two time stages for traps (red and blue) and for hydrocarbon migration (yellow and pale blue). C. Map of highs, which during inversion migrate from yellow to blue position.
