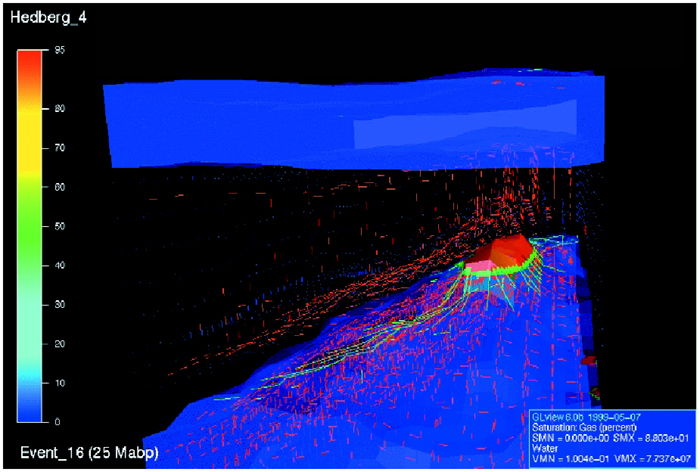
Figure 2. Close-up of one of the reservoirs. Red vectors indicate free-phase gas transport (e.g., loss from the reservoir ) in the low-permeability parts of the model. (Courtesy of Norsk Hydro.)
Figure 2. Close-up of one of the reservoirs. Red vectors indicate free-phase gas transport (e.g., loss from the reservoir ) in the low-permeability parts of the model. (Courtesy of Norsk Hydro.)